To make your graphs:
- Make an easy-to-read graph that fills the space you
make available for it (no blank spaces). Both sets of data will be graphed together on one sheet of graph paper. Volume goes on
the x-axis and Mass goes on the y-axis.
- This is best accomplished by setting up your axes before you start graphing.
- Make sure the largest value to be graphed on each axis will be on the graph.
- Select a spacing on the available scale so that you can easily figure out where each decimal is located. (Do not use any multiples of 3. Instead, make sure to have unit, 2-unit, 5-unit, 10-unit, or 25-unit spacings).
- Use a ruler to draw a line of best fit: this line may not go through the data points! It just needs to pass as closely as possible to all the data points.
- Using points on the line (not data points!) determine the slope of the line; the slope is the constant of proportionality and shows how mass relates to volume. The slope is calculated as the change in mass over the change in volume. Density is defined as D = m/V.
- Using your graph or your knowledge of algebra find the y-intercept of the line
- Determine the correct units for both the slope and the y-intercept.
- Write the equation of the line in y-intercept form using variables appropriate to the data. That is, m for mass instead of y and V for volume instead of x.


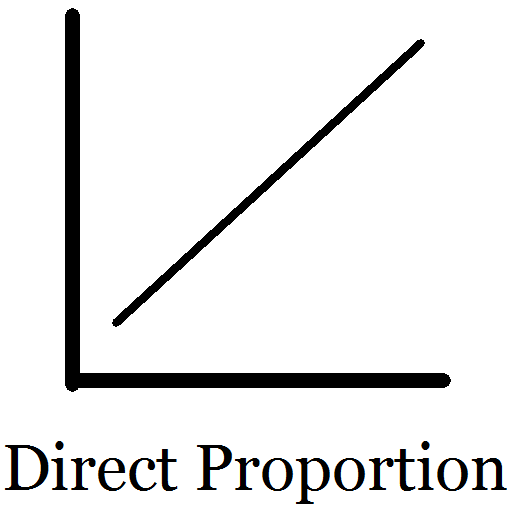
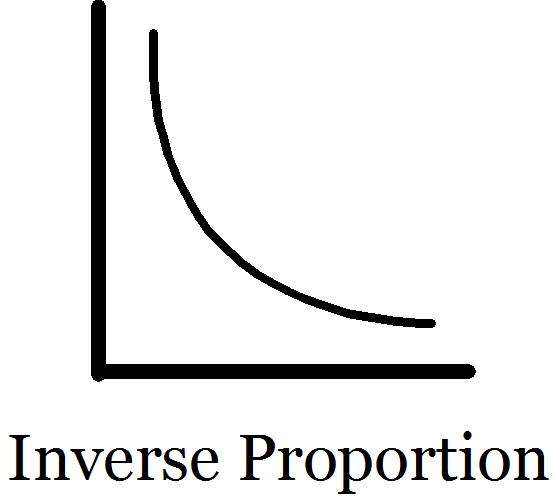
Direct proportions have graphs which show a straight line as the best way to connect the dots. For two variables in a direct proportion, when one gets larger, the other does, too. Inverse proportions have graphs which show an inverse curve as the best way to describe the pattern of dots. For two variables in an inverse proportion, when one variable increases, the other decreases.
Questions
Answer these questions on a separate sheet of paper using complete sentences. Show work for all mathematical questions.
- If you compare two pieces of the same material that have different volumes, which one has a larger mass: the smaller one or the larger one? Is there a direct or an inverse proportion between the mass of a sample and the volume?
- Give the equation of the line for the copper data. Also, give the equation of the line for the aluminum data.
- What units should be used when you report the slope? Why? Consider that slope is defined as the change in y divided by the change in x (Δy/Δx). Δy = y2 – y1 and Δx = x2 – x1
- What does the value of the slope of your graph represent?
- Is the slope the same for each point on the graph?
- Is the density of copper the same for every sample? How about the aluminum? Justify your answer based on the graph you made.
- Using your graph, find the volume of 155 g of Al.
- Using the equation of the line, calculate the volume of 155 g of Al. Show your work.
- Why is the slope of the line for the copper data different from the slope of the line for the aluminum data?
- The y-intercept is the value of the variable on the y-axis when the value on the x-axis equals zero. With ideal data in an ideal world, what should the value of the y-intercept be for both graphs? Why?
Grading
For this assignment you must turn in the answers to these questions and your sheet of graph paper showing both graphs and including all of the information required in the instructions for making the graphs. This will count toward your lab grade.