Carbon has two common isotopes: carbon-12
(12C) and carbon-13
(13C). The number
that is superscripted to the left of the atomic symbol is the
atomic mass number. It tells you the approximate mass of a
particular isotope. Recall that isotopes are atoms of an element
with different numbers of neutrons. Isotopes can be told apart by
their mass numbers. The mass number (A) equals the sum of the
number of protons and neutrons (A = Z + n0).
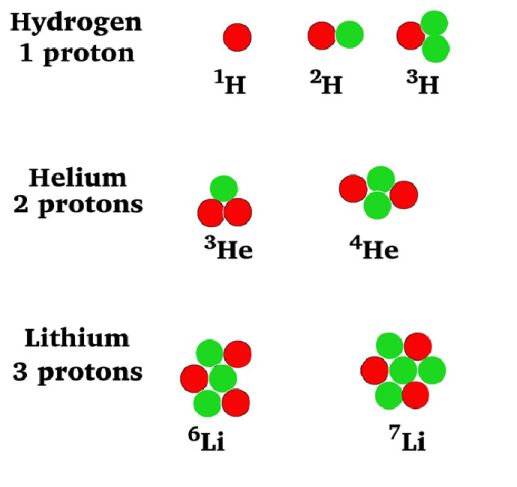
Fill in the
following table with the required information about the isotopes in the picture
at left.
| Name |
Symbol |
p+ |
n0 |
Mass |
| hydrogen-1 |
1 1H |
1 |
0 |
1 |
| |
|
|
|
|
| |
|
|
|
|
| |
|
|
|
|
| |
|
|
|
|
| |
|
|
|
|
| |
|
|
|
|
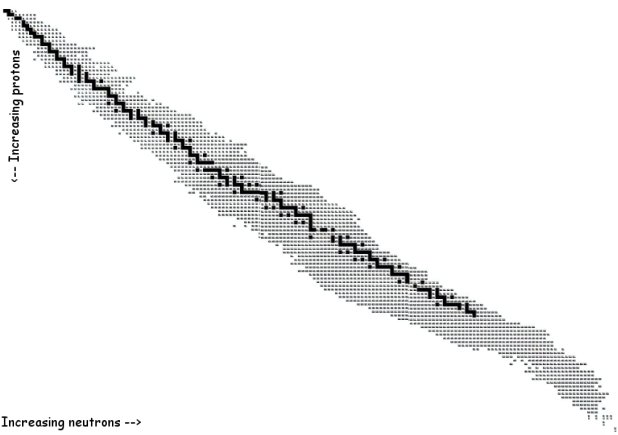
The above is an image showing all of the known isotopes. Each
speck represents one isotope. The black specks running down the
middle represent the stable isotopes. What are stable isotopes?
Those are atoms that do not emit radiation. Stable isotopes are
like a solidly built skyscraper: they are made to withstand the
pressure of high winds and the shaking of earthquakes. Stable
isotopes are built to withstand the outward push of the protons:
since they all have a positive charge, they push against each
other to get away. The strong nuclear force pulls them back in
but they need neutrons to get enough strong nuclear force to keep
them from flying apart.
The more protons there are in an atom (the higher the atomic
number) the more neutrons are needed to keep the atom from flying
apart. Take a look at the following graph:
The graph shows atomic number (Z) across
the x-axis and number of neutrons (A – Z) along the y-axis.
Remember, Z + n0 = A, (A is the atomic mass
number).
The line on the graph represents the
places on the graph where p+ = n0. This is
the same as saying Z = A – Z.
All the specks on the graph represent
isotopes. The stable isotopes are always in the middle of the
crowd, so to speak. For low numbers of protons
| Electric Forces |
| + <—> + |
| + >–<
– |
| – <—>
– |
(low Z) the number
of protons and neutrons is fairly equal. At first, there is a
one-to-one ratio. As Z climbs higher, more and more neutrons
appear to be needed in order to make the atomic nuclei
stable.
How do we explain this? There are two
forces at work: electrostatic forces and the strong nuclear force. The electrostatic force makes the
protons in the nucleus try to fly away from one another. Positive
charges repel each other; positive and negative charges are
attracted to one another; and negative charges repel each other.
Protons are positive and are repeled from one another. The
electrostatic force has no effect on neutrons. (Why?) The closer
two particles are, the stronger the electrostatic force between
them.
The strong nuclear force acts on protons
and neutrons and pays no attention to charge. It acts over very
small distances (1 × 10-15 m) and makes nuclear
particles stick together. The more nuclear particles (protons and
neutrons) there are, the stronger the strong nuclear force
is.
There are two kinds of unstable nucleus.
One, there are too few neutrons to balance the electrostatic
repulsion of the protons. Two, there are too many neutrons and
the nucleus is crushed together so much that the protons are
repelled more strongly. Either way, the nucleus is unstable. This
is the origin of radioactivity.
Questions
- What are the units of atomic masses?
What is the mass of a proton? A neutron?
- What is the definition of the atomic
mass number?
- What is the meaning of the number that
often follows the name of an element?
- When the name of an element is followed by a number, what does it refer to, an isotope or an element? Why?.
- What force is it that makes atomic
nuclei try to fly apart? Which subatomic particle in the nucleus
responds to this force?
- Why doesn’t the neutron respond to
the force mentioned in the previous problem?
- What force is it that makes nuclei try
to hold together?
- What causes a nucleus to be unstable?