Radioactive isotopes may decay in a variety of ways. Alpha decay emits a helium-4 nucleus. Beta-minus decay emits an electron and beta-plus causes a positron to be emitted. In electron capture, the nucleus absorbs an electron. Some nuclei spontaneously fission into smaller nuclei, along with the emission of one or more neutrons. A few nuclei emit a proton or neutron. What causes a nucleus to decay in the first place? And why do nuclei decay in one way and not the others? These are some questions this activity will help you to understand.
There are four forces of nature: gravity, electromagnetism, the strong nuclear force, and the weak nuclear force. All of these are more properly the subject of a physics class, although the last two are only covered in upper-level college physics courses. However, in order to better understand nuclear chemistry, unstable isotopes, and radioactivity it is necessary to discuss the interplay between electromagnetism and the strong nuclear force in atomic nuclei.
|
|
| Figure 1 |
The electromagnetic force is probably most familiar to those who have played with magnets. Magnets have a north pole and a south pole. Like poles repel each other and opposite poles attract. In a similar way, electric charges attract and repel one another, with like charges repelling and opposite charges attracting. It is this aspect of the electromagnetic force that is relevant to atomic nuclei. An atomic nucleus is generally composed of one or more protons along with some neutrons. While the neutrons are true to their name and carry no electric charge, protons each carry +1 unit of charge. Since they are positively charged, they repel each other. The closer two charges get, the stronger the force between them. Within a nucleus, protons are within 10–15 m of each other so the force repelling them is extremely high. This distance of 1 × 10–15 m is also called a femtometer (fm). It is smaller than an atom by a factor of 33,000. And atoms, as you know, are also quite small.
|
| Figure 2 |
The strong nuclear force acts on nucleons (that is, protons and neutrons) only. The force originates in the very nature of these particles. The force has a very short range of about two femtometers (2 fm, 2 × 10–15 m). Within that range, protons and neutrons create and feel a force that makes them stick to one another. At distances greater than that, only the electromagnetic repulsive force is felt by protons, which pushes them away. Neutrons are not repelled, having no charge, but cannot be captured into a nucleus unless they get within 2 fm of the center of one. The strong nuclear force is, as its name indicates, very strong. However, it is not strong enough to hold two protons together against their electromagnetic repulsion. Imagine an atomic nucleus made of two protons and zero neutrons. Such a nucleus is impossible and in order to overcome the repulsion between the positive charges, neutrons are needed. Neutrons and protons feel the same amount of force due to the strong nuclear force. So when neutrons are present they contribute to the overall attractive force, without adding to the repulsive electromagnetic force. As a result, a nucleus with two protons can exist if just one neutron is added. This is one of two possible isotopes of helium: helium-3, 32He. In order for a nucleus to exist the balance of forces must favor the strong nuclear force. The total repulsion due to the electromagnetic force must be less than the total attraction due to the strong nuclear force. The balance of forces is shown schematically in figure 1, at left.
This balance is best maintained with the right ratio of neutrons to protons. For some elements, the ratio of 1 neutron for every 1 proton is found in stable nuclei. For these elements a ratio of n0/p+ that is larger or smaller than 1 is found in radioactive nuclei. When the ratio is larger than 1, neutrons outnumber protons. As a result, the strong nuclear force overbalances the electric repulsion. For unstable nuclei with a n0/p+ ratio greater than 1, the most common decay mode is by beta decay. Beta decay, as you have learned already, is the emission of an electron from the nucleus of an atom. The electron’s mass comes from the enormous potential energy of the unstable nucleus by way of E = mc2. In the process of the electron’s creation a neutron is transformed into a proton. This transformation takes place according to rules governed by the weak nuclear force. The daughter nucleus has a smaller n0/p+ ratio as a result of a neutron becoming a proton. This leads to a daughter nucleus which is more stable than the parent nucleus.
On the other hand, for unstable nuclei with a n0/p+ ratio greater than 1, the most common decay mode is by beta-plus or positron decay. Positron decay is the emission of an positron (the positively charged antimatter counterpart of the elctrons) from the nucleus of an atom. In the process of the positrons’s creation a proton is transformed into a neutron. Electron capture is another alternative. In this decay mode, an electron is absorbed by a neutron in the nucleus with the result that a proton is transformed into a neutron. In either case the daughter nucleus has a larger n0/p+ ratio as a result of a proton becoming a neutron. Some nuclei have just one decay mode, others may decay by both.
| Range of Atomic Numbers | Average n0/p+ Ratio |
| 0 - 20 | 1.00 |
| 21 - 40 | 1.23 |
| 41 - 60 | 1.36 |
| 61 - 80 | 1.47 |
| >80 | 1.51 |
The graph in Figure 2 is known as the Neutron Excess graph. It plots all of the elements by atomic number across the x-axis. The y-axis plots the number of neutrons. Each location on the graph with a small box plots a known atomic nucleus. Boxes with a black dot are stable nuclei. Boxes with a red dot are naturally occurring unstable nuclei. Empty boxes are artificially made unstable isotopes. Note the line marked “N = Z”. This line shows every location on the graph where the number of neutrons is equal to the number of protons for a nucleus plotted on the graph. The graph is called the Neutron Excess graph because because as atomic number increases, the number of neutrons per proton also increases. For the first twenty elements, the stable isotopes are plotted either on or very near this line. But as atomic number increases the stable isotopes begin to move upward away from the N = Z line. This indicates that the number of neutrons is beginning to exceed the number of protons for these nuclei. So it turns out the ideal n0/p+ ratio is not always a one-to-one ratio. Rather, the ratio steadily increases with increasing atomic number. The table at left gives the average n0/p+ ratio for each group of 20 elements and you can see that the ratio gradually increases to about 1.5. For atoms with a mass number greater than 209, there is no stable ratio.
The main thing to take away from this is that stable isotopes do not always have a one-to-one n0/p+ ratio. This has an important implication about predicting the likely decay mode of a particular unstable isotope. It is not enough to calculate its n0/p+ ratio and compare that value to one. Some stable isotopes have a n0/p+ ratio as high as 1.5. Instead, you have to take the element’s atomic number into account. What range does it fall in on the Neutron Excess graph? Is the n0/p+ ratio of this isotope higher or lower than the ratio expected for its position on the graph? Put more simply, does the isotope have a mass number greater than or less than the average atomic mass of the stable isotopes of an element? Consider that the average atomic mass is the average of the masses of the stable isotopes of a given element. Given that a specific isotope is unstable, you can predict the decay mode by comparing the isotope’s mass number to the element’s average atomic mass. A few examples will serve to make this idea clear.
| Isotope | n0/p+ ratio | Mass No. | Element Average Atomic Mass | Likely Decay Mode |
| 146C | 1.33 | 14 | 12.0 | Beta-decay |
| 116C | 0.83 | 11 | 12.0 | Positron or EC decay |
| 13050Sn | 1.6 | 130 | 118.7 | Beta-decay |
| 10850Sn | 1.16 | 108 | 118.7 | Positron or EC decay |
Consider two isotopes of carbon. One has a mass number larger (146C) and the other smaller (116C) than carbon’s average atomic mass. With a mass number higher than the average atomic mass, carbon-14 has too many neutrons. As a result, one of the neutrons changes into a proton in beta decay. This corresponds to a move on the graph one place to the right and one place down. The carbon isotope with a mass number lower than the average atomic mass, carbon-11, has too many protons. This makes it most likely that it will decay by positron decay or electron capture. Either of these reduces the number of protons by one and increases the number of neutrons by one. On the graph this would be a move to the left and up. Similar remarks would apply to the
|
| Figure 3 |
In general, isotopes found on the graph to the left or above the stable isotopes tend to decay by beta decay. Those to the right or below the stable isotopes are likely to decay by positron or electron capture. See figure 3.
Predicting that an isotope is likely to decay by beta decay is simply a matter of knowing whether the mass number of that isotope is higher than the mass of stable isotopes of that element. Similarly, if an isotope’s mass number is lower than the mass of stable isotopes you can tell it is likely to decay by positron decay or electron capture. But what about alpha decay? Alpha decay takes place based on a completely different process than those discussed so far. A large nucleus with a mass number greater than 209 is the best candidate for an isotope likely to decay by alpha decay. Such nuclei are so large that the strong nuclear force simply cannot hold them together permanently. When alpha decay occurs, a helium-4 nucleus forms from the protons and neutrons of the large nucleus and is ejected. This eventually leads to a more stable nucleus by reducing the size until the nucleus is small enough for the strong nuclear force to exceed the electric repulsion by a large enough margin. Predicting alpha decay is challenging because some large atoms decay by beta decay in order to make their n0/p+ ratio closer to a stable ratio, even when no atoms in a particular mass range have any stable isotopes. But for the most part, if the atom has a mass number greater than 209, its most likely decay mode is alpha decay.
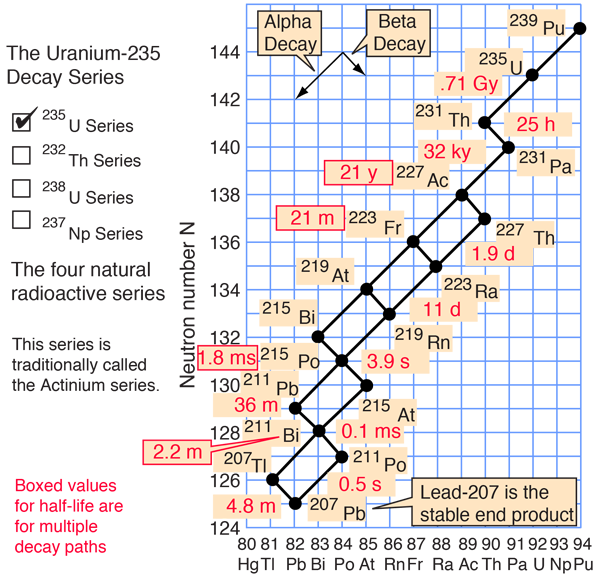
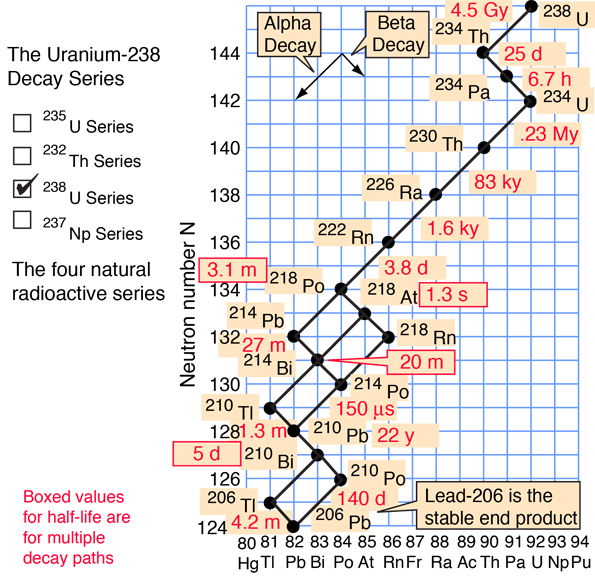
There are several heavy elements which have isotopes with very long half-lives. Once they do decay, however, their daughter nuclei are often very short-lived. Here are two of the natural decay series, as illustrated by HyperPhysics:
|
|
| 1μs = 10-6s, 1 ms = 10-3s,1 My = 106y, 1 Gy = 109y | |
Answer questions with complete sentences, when appropriate.