Attention: Print this page in 'landscape' mode because the table is too wide to fit when printed in 'portrait' mode.
Reaction Order
Differential Rate Law
Integrated Rate Law
Linear Form
Characteristic
Kinetic Plot
Half-life
Expression
Units of
Rate Constant
Zero
-
d [A]
d t
= rate = k
[A] = [A]0 - k t
[A] = -k t + [A]0
[A] vs t
t½ =
[A]0
2k
mole L-1 sec-1
First
-
d [A]
d t
= rate = k [A]
[A] = [A]0 e- k t
ln[A] = -kt + ln[A]0
ln [A] vs t
t½ =
ln(2)
k
sec-1
Second
-
d [A]
d t
= rate = k [A]2
[A] =
[A]0
1 + k t [A]0
1
[A]
= k t +
1
[A]0
1/[A] vs t
t½ =
1
k[A]0
L mole-1 sec-1
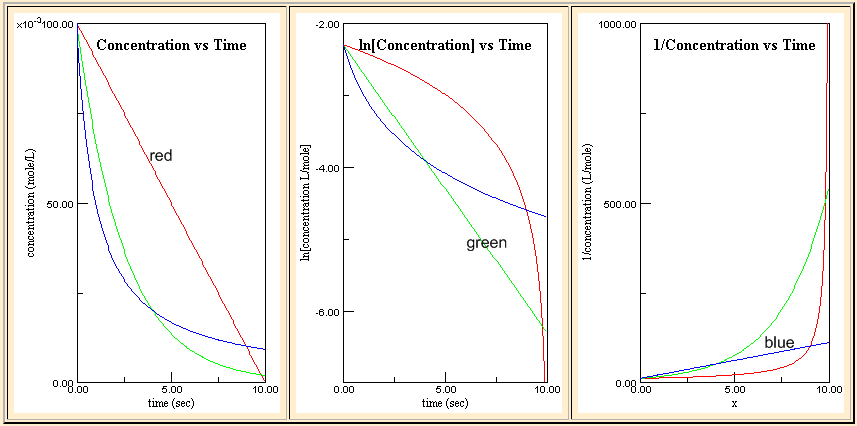
The series of three graphs shown below illustrate the use of the characteristic kinetic plots.
The graph on the left shows [A] vs t plots for a zero-order (red line),
first-order (green line), and second-order (blue line) reaction.
The graph in the middle shows ln [A] vs t plots and the graph on the right shows 1/[A] vs t plots for each reaction order.