Measurement and
Variation
Measurement Technique
Posing and answering questions in science is accomplished through the practice of making measurements. Whether your conclusions can be believed or whether they should be dismissed depends on whether your measurements can be trusted. Good measurement technique is essential to the creation of trustworthy measurements. In making any measurement with a tool marked in metric units it is essential to estimate the distance between two marks on the tool and give the estimate as part of the measurement. To illustrate this idea, find a paperclip and measure it on each of the following rulers:
On this ruler only the zero and the 10 cm mark are clearly given. In order to make a measurement you have to estimate the length by imagining the space broken into ten equal segments. By choosing the number that seems closest to the number of these segments you can make a measurement with one estimated digit. This measurement has exactly one significant figure. Write your measurement to the right of the ruler above.
On this ruler marks are given for every centimeter. Place your paperclip carefully at the zero mark and measure its length using this ruler. It is likely that the paperclip’s end falls somewhere between two marks on the ruler. Divide the space between those two marks into ten equal segments in your mind. Estimate the number of these equal segments needed to get to the end of the paperclip. This digit is the tenths place of your measurement. By having two significant figures this new measurement includes one certain digit (the one based on the marks on the ruler) and one estimated digit. Write your measurement, to the nearest tenth of a centimeter, to the right of the ruler above.
This last ruler reaches the practical limit for rulers that can easily be used by hand to make precise measurements. The marks are now every tenth of a centimeter. (By the way, one tenth of a centimeter equals a millimeter). Place your paperclip very carefully onto the zero mark of the ruler. If you bring your eyes close and peer with great attention you will be able to see that the paperclip’s end probably falls in between two of the tenth-of-a-centimeter marks. Mentally break this space into ten equal segments and
 |
|
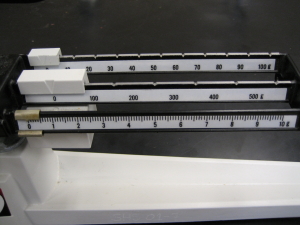
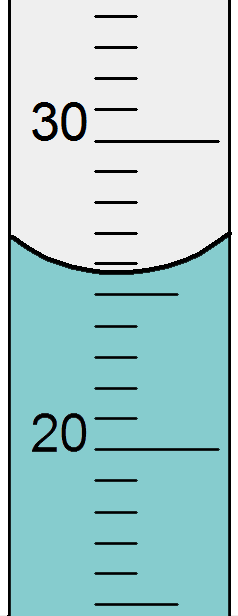
This technique of estimating between the lines to find the final significant figure in a measurement applies to all measurements you might make. For example with a lab balance to find mass in grams or with a graduated cylinder to find volume in milliliters. As you can see in the illustration of the beams of a three-beam lab balance (at right) the final scale is marked to the nearest tenth of a gram. This means that the estimated digit will be to the nearest hundredth of a gram. Even for small masses this means you will have a minimum of three significant figures. When using a graduated cylinder you will estimate between the lines as well. Be careful because differently-sized cylinders have different scales and the digit you estimate may not be the same. To correctly read the volume in a graduated cylinder you read it as if there were a horizontal line that crossed the bottom of the meniscus. The meniscus is the name for the curved top surface of water in a narrow container. See the illustration at right to get an idea of what this looks like. In the illustration the correct reading is 25.7 mL (although others might disagree about the final digit).
Significant Figures
Significant figures are all the digits of an actual measurement. By definition, they include all of the digits we can be certain about plus one estimated digit. Only one digit can be estimated because estimating two digits would require mentally breaking up a space into 100 equal segments and it is impossible to do this accurately. The number of significant figures gives important information about the precision of a measurement. Precision is a measure of how close together a series of measurements of the same quantity are to each other. When a measurement has more significant figures it is more precise because repeated measurements of the same object will be closer together. For example, let us say that Rolf measures the paperclip on the first ruler above and finds that the paperclip is 2 cm long. If Maria measures the same paperclip she may estimate that the paperclip is 3 cm long. These measurements are a whole centimeter apart and are therefore not very precise. However, if Rolf uses the third ruler and measures the paperclip to be 2.94 cm long and Maria measures it and finds that it is 2.91 cm long then the measurements are only 0.03 cm apart. This is much more precise.
Accuracy is a different idea from precision. Accuracy is a measure of how close a measurement is to the true or correct value. Sometimes accuracy can be judged, as when you compare your result to a standard value. Sometimes it is not possible to know how accurate a measurement is because it is only possible to compare the measurement to other measurements you make of the same thing.
| Copper (Cu) | ||
| Volume (± 0.1 mL) | Mass (± 0.1 g) | Density (± 0.01 g/mL |
| 11.1 | 101.2 | 9.18 |
| 20.4 | 178.9 | 8.77 |
| 35.3 | 311.5 | 8.82 |
| 42.2 | 373.5 | 8.85 |
Experimental Variation
When making measurements in order to be able to draw a scientific conclusion it is necessary to make repeated measurements of the same thing. For example, if you want to measure the density of a material you must measure both the mass and the volume of several samples of the same material. By dividing the mass by the volume for each sample you will find the density for each sample. As you can see in the data table at right, there is some variation in the results: not all of the density values are exactly equal to each other. This does not mean that the density of copper is not a constant. Under the same conditions a sample of copper will always have the same density. The fact that the results vary is not a property of the copper; instead, it is a property of the measurements that were made. This kind of variation is natural and expected. Because no measurement is perfect we can anticipate that some measurements will be higher than the true value and some will be lower. This is why we calculate the average value. Finding an average evens out the too-high and the too-low values.
Average
                                               35.62
9.18 + 8.77 + 8.82 + 8.85 = 35.62             ------- = 8.905
                                                 4
In the calculation of the average we have found a result of 8.905 g/mL. This result provides more significant figures than the data we started with and therefore seems to say it is much more precise. We know it can’t be more precise than the measurements we made to calculate it: the density values varied in the hundredths and the tenths place. Look at the values to confirm this. Therefore it makes sense to round off the result to 8.9 g/mL. This preserves the digit we are reasonably certain about (the 8) and one digit that is a bit uncertain (the 9). In this way we stick with the rule for significant figures that a measurement includes all of the certain digits plus just one estimated (or uncertain) digit.
Perhaps it is not quite clear how to figure out where to round off a result. One way to be sure to do it correctly is to calculate the range of the data and to use it to identify which digit of the measurement is showing variation. Here is how to find the range: subtract the smallest value from the largest value.
Range9.18 - 8.77 = 0.41
Round this number to just one significant figure, in this case to 0.4. This means that there is range of measurement values of 0.4 g/mL around the average. One way to report this is to say that the values are anywhere from the average plus 0.2 to the average minus 0.2. This number (0.2 in this case) is half of the range and is called the plus-or-minus amount. Use the place value of the plus-or-minus amount to decide where to round your average. Report the result with the average, the plus-or-minus amount, and the unit, like this:
8.9 ± 0.2 g/mL
Procedure
For this activity you will practice making measurements using the maximum possible precision of each tool. Make each measurement by estimating the final digit using the technique described in the background text. In a group of 4, have each member separately measure each item. Using the group members’ data, calculate the average, range, plus-or-minus amount, and report the result as shown in the example column.
| Example | Paperclip | Book | Beaker | Pencil | 10 mL Cylinder | 100 mL Cylinder | |
| Name | Density (g/cm3) | Length (cm) | Length (cm) | Mass (g) | Mass (g) | Volume (mL) | Volume (mL) |
| 1 | 2.75 | ||||||
| 2 | 2.60 | ||||||
| 3 | 2.49 | ||||||
| 4 | 2.95 | ||||||
| Average | 2.6975 | ||||||
| Range | 0.46 | ||||||
| ± Amount | 0.23 (0.2) | ||||||
| Result | 2.7 ± 0.2 g/cm3 |
Grading
For this lab you must turn in your lab data and calculations and answer the lab questions at the end of this handout. Lab data may be hand-written and photographed for inclusion in your report, provided they are legible. In a typed document answer the questions below and submit your document as a Google Doc to the relevant assignment on Google Classroom. All numbers in your answers must be expressed with the correct number of significant figures.
You will be graded on the quality of your writing, the professionalism of your work’s appearance, and the quality of the answers to the questions.
Questions
- Using the text in the lab handout define the terms certain digit and estimated digit.
- What is the definition of precision according to the information in this lab handout? How can you tell when a set of measurements is precise?
- In general, how do you determine the decimal places of the certain digits and the estimated digit for a measurement instrument?
- Based on the marked lines on the ruler you used in class, what digits of a measurement in centimeters will be certain? What digit of a measurement will be estimated?
- What place value would need to be marked on a ruler to be able to estimate the 1000ths place (to the nearest 0.001)? Explain.
- Give a summary of the procedure in which you use the range of values to decide which decimal place to round your average to. This involves calculating the plus-or-minus amount (± Amount) and using its place value.
- Consider the following two measurements:
3.41 ± 0.04 cm and 3.41 ± 0.09 cm
Which of these measurements has better precision? Explain. - Can the ruler you used distinguish between objects whose true lengths are 6.575 cm and 6.577 cm? Explain.
- Consider the plus-or-minus amounts you calculated for your length measurements. Was the variation in your measurements equal to ±0.01 cm or greater than ±0.01 cm?
- Considering how rulers are used, and especially the need to precisely place the zero of the ruler on the object, explain why there is variation typically greater than 0.01 cm in measurements made by more than one person.
- What is place value of the estimated digit, in milliliters (mL), of a measurement made with
- the 10-mL graduated cylinder
- the 100-mL graduated cylinder
- Which of the graduated cylinders could distinguish the smallest differences between two measurements? In other words, which one had its estimated digit furthest past the decimal for measurements in milliliters?
- Imagine you are using a graduated cylinder like those used in this lab. Is it theoretically possible to make a valid measurement—with only one estimated digit—which could distinguish between a volume of 55.42 mL and 55.43 mL? Why or why not?
- What digits are certain and which digit is estimated when using the three-beam-balance?
- Which measurement has higher precision: 4 cm or 4.05
cm? Explain how you know.
- Draw a ruler which could be used to make a measurement to the nearest 0.01 cm, for example, 4.23 cm.
- Draw a ruler which would be limited to making measurements to the nearest whole cm, for example, 4 cm.