Lab: Selecting Indicators for Acid-Base Titrations
Introduction
Topics:- About Titrations
- Indicators
- Calculations
- Graphs of pH in Titrations
Weak Acid Titrations
A weak acid is a weak electrolyte which dissolves in water mostly as molecules which retain their acidic proton. Only a small percentage of molecules are ionized to produce an anion (the conjugate base of the acid) and a hydrogen ion, or proton. When a weak acid reacts with a strong base it does so completely, even when the strong base is a limiting reactant. If there is not enough strong base to completely neutralize the weak acid then the solution becomes one in which the weak acid and its conjugate base both have non-zero initial concentrations. This situation is described as a buffer and the pH can be calculated using the Henderson-Hasselbalch equation:
pH = pKa + log([A–]/[HA])provided the concentration is not so low as to be similar in size to the Ka of the acid. The pH of the solution can be calculated in this way up to but not including the equivalence point. The equivalence point of a titration is just when the number of moles of added base is stoichiometrically equivalent to the number of moles of weak acid in the original solution.
At the equivalence point, by definition, all of the weak acid molecules have been stripped of their acidic proton and exist in solution exclusively as the conjugate base:
HA + NaOH ⟶ NaA + H2OThe single arrow in the equation above shows that the reaction goes to completion and is not an equilibrium. The salt NaA is a strong electrolyte and dissociates completely in solution. The sodium ion is inert in acid-base reactions but the anion, A–, is a weak base. Since all of the sodium hydroxide has been used up and no HA remains the pH at the stoichiometric equivalence point is determined by this equilibrium:
A– + H2O ⇌ HA + OH–which is the hydrolysis of the weak base that is the conjugate base of the original weak acid.
After the equivalence point there is no more HA and the added sodium hydroxide, being a much stronger base than A–, dominates the solution in terms of determining the pH. To calculate pH the moles of excess sodium hydroxide divided by the total volume gives the concentration of OH–.
Weak Base Titrations
A weak base is a weak electrolyte which dissolves in water mostly as molecules which do not bind to an acidic proton. Only a small percentage of molecules are ionized to produce the conjugate acid of the base and a hydroxide ion. When a weak base reacts with a strong acid it does so completely, even when the strong acid is a limiting reactant. If there is not enough strong acid to completely neutralize the weak base then the solution becomes one in which the weak base and its conjugate acid both have non-zero initial concentrations. This situation is described as a buffer and the pH can be calculated using the Henderson-Hasselbalch equation provided the concentration is not so low as to be similar in size to the Ka of the acid form of the base. The A– in the expression is the weak base being titrated and the HA is its conjugate acid. The pKa is that of the conjugate acid. The pH of the solution can be calculated in this way up to but not including the equivalence point.
At the equivalence point, by definition, all of the weak base molecules have bonded to an acidic proton and exist in solution exclusively as the conjugate acid:
A– + HCl ⟶ HA + Cl–The single arrow in the equation above shows that the reaction goes to completion and is not an equilibrium. The chloride ion is inert in acid-base reactions but the acid, HA, is a weak acid. Since all of the hydrochloric acid has been used up and no A– remains the pH at the stoichiometric equivalence point is determined by this equilibrium:
HA ⇌ H+ + A–which is the hydrolysis of the weak acid that is the conjugate acid of the original weak base.
After the equivalence point there is no more A– and the added hydrochloric acid, being a much stronger acid than HA, dominates the solution in terms of determining the pH. To calculate pH the moles of excess hydrochloric acid divided by the total volume gives the concentration of H+.
Indicators
An indicator is a weak acid which has different visible colors depending on whether it is protonated or not. When the indicator is in sufficiently acidic solution it has the color of the form which has an attached hydrogen ion. When the indicator is in sufficiently basic solution it has the color of the form which has no attached hydrogen ion.
The color-change range of an indicator spans about 2 pH units. This has to do with the ratio of the concentration of the protononated form (HIn) to the concentration of the de-protonated form (In–). If the concentration of HIn is ten or more times greater than the concentration of In– then the color of HIn dominates. If the concentrations of HIn and In– are close to being the same, that is, close to having a one-to-one In–/HIn ratio, then the color observed is a mixture of the two forms’ colors. If the concentration of In– is ten or more times greater than the concentration of HIn then the color of In– dominates.
Figuring out which form is in the majority is made simple by the use of the Henderson-Hasselbalch equation:
The pH in the solution in a titration is determined completely by the composition of the solution and is not really affected by the small amount of indicator present. In this equation the value of the pH can be substituted in and the ratio [A–]/[HA] can be understood to be [In–]/[HIn]. All that is needed is the pKa of the indicator. The pKa of some common indicators is given in the table at right.
| Common Indicators | |
| Name | pKa Value |
| Methyl Orange | 3.47 |
| Methyl Red | 4.95 |
| Bromothymol Blue | 7.10 |
| Phenolphthalein | 9.40 |
| Thymolphthalein | 10.00 |
It is necessary to know the theoretical pH at the equivalence point of a titration in order to select the correct indicator. The indicator cannot show the equivalence point precisely because it changes color over a range of 2 pH units. However, it can show the endpoint of the titration. The rate of change of pH just before and after the equivalence point is practically infinite and the range of pH from just before to just after equivalence can be 4 or 5 pH units. As long as the indicator changes color within this larger range it will clearly show the end of the titration, that is when the volume delivered up to that point contains a stoichiometrically equivalent amount of acid or base.
Calculations
Depending on the amount of titrant added there are four different methods needed to calculate the pH of the solution for that amount of added strong acid or strong base.
- Before any titrant is added the pH depends only on the simple dissociation of the weak acid or base according to their Ka or Kb expression. Set up an i.c.e. table with all concentrations of products set to zero initially.
HA ⇌ H+ + A– A– + H2O ⇌ HA + OH– - When some amount of titrant is added but equivalence has not yet been reached. This requires two steps:
- Perform a stoichiometric calculation to determine the amount of weak acid that has been converted to the conjugate base (or the amount of the weak base that has been converted to the conjugate acid).
- Perform an equilibrium calculation using the new initial concentrations of HA and A–. Or use the Henderson-Hasselbalch equation.
- At the equivalence point when the original acid or base has been completely converted into its own conjugate. At this point only the conjugate base of the weak acid (or the conjugate acid of the weak base) is present in solution. By using its concentration in the new total volume and setting up the proper equilibrium calculation it is possible to determine [H+].
- After the equivalence point when excess titrant has been added. Calculate pH based on the moles of excess added strong acid or base using the new total volume of the solution.
Graphs of pH in Titrations
A Weak Acid Titrated with a Strong Base
In this graph 50.0 mL of a 0.20 M solution of acetic acid (CH3COOH) is titrated with a 0.10 M solution of sodium hydroxide (NaOH). The appropriate indicator for the titration is phenolphthalein because it has a color-change range from pH 8.4 to 10.4. The pH expected at the equivalence point is 8.72 and the pH jumps from 6.7 at one mL of base before equivalence to 10.8 at one mL of base past equivalence.
A Weak Base Titrated with a Strong Acid
In this graph 50.0 mL of a 0.20 M solution of ammonia (NH3) is titrated with a 0.10 M solution of hydrochloric acid (HCl). The appropriate indicator for the titration is methyl red because it has a color-change range from pH 5.95 to 3.95. The pH expected at the equivalence point is 5.13 and the pH jumps from 7.2 at one mL of acid before equivalence to 2.2 at one mL of acid past equivalence. The pH at equivalence is below 7 because the species in solution that controls pH at that exact point is the conjugate acid of the weak base being titrated.
A Weak Acid and a Strong Acid Titrated with a Strong Base
In this graph 50.0 mL of a 0.20 M solution of acetic acid (CH3COOH) is titrated with a 0.10 M solution of sodium hydroxide (NaOH). For purposes of comparison, a similar titration of 50.0 mL of a 0.20 M solution of hydrochloric acid (HCl) is also displayed on the same graph.
While the strong acid has a pH at equivalence of 7.00 the weak acid, in this case, has a pH of 8.72. This is because the chemical species present at equivalence in each case are different. For the strong acid/base titration the species present at equivalence have no effect on pH. For example, the chloride ion (Cl–) and the sodium ion (Na+) are not basic and not acidic.
At equivalence for the weak acid titration the species in solution include the sodium ion, the conjugate base of the acid, and water. The weak base is the only one of these that has an effect on pH and since it is a base, the pH is above 7 at equivalence.
Objective
In this activity your group will perform two titrations: one titration of a weak acid with a strong base and one titration of a weak base with a strong acid. You will measure pH at each small addition of the titrant and you will continue adding titrant well past the endpoint of the titration so that a graph may be made of volume added vs. pH.
Materials
- 25.00 mL 0.500 M
acetic acid solution - phenolphthalein
indicator solution - 25.00 mL 0.500 M
ammonia solution - methyl red indicator solution
- ~50 mL 0.500 M
sodium hydroxide solution - ~50 mL 0.500 M
hydrochloric acid solution - pH buffer solution, 4.00
- pH buffer solution, 7.00
- distilled water
- Digital pH meter
- 2 250-mL beakers
- magnetic stirrer and stir bar
- 2 50-mL burets (shared with another group; one for NaOH and one for HCl)
- ring stand with buret clamp
- clamp to hold pH meter
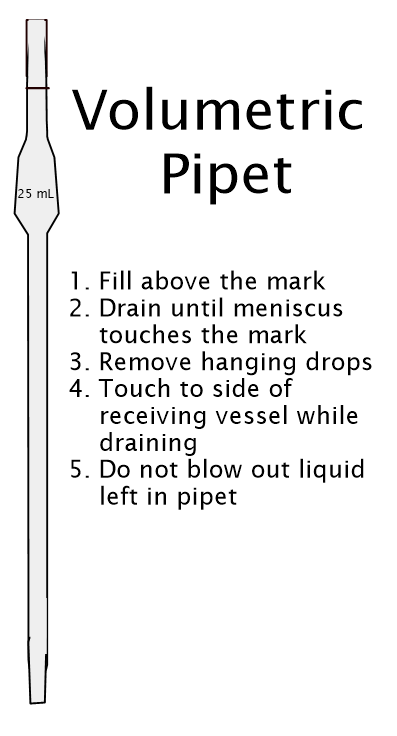
- pipet bulb
- 25-mL volumetric pipet
- wash bottle
Pre-lab Problems
The following problems will help you to understand the concepts involved in this lab and to be able to do the math required for the analysis of your lab results.
- One of the titrations you will do in this lab will be the titration of 25.00 mL of 0.500 M acetic acid (CH3COOH, Ka = 1.8 × 10⁻⁵) with 0.500 M sodium hydroxide (NaOH).
- Calculate the volume of NaOH solution you will need to reach stoichiometric equivalence.
- Calculate the pH at the equivalence point. Remember, at this point all of the CH3COOH has been stoichiometrically converted into CH3COO– and the volume of solution will have increased as well.
- Use the table of pKa values from the introduction to choose an appropriate indicator for this titration.
- The other titration you will do in this lab will be the titration of 25.00 mL of 0.500 M ammonia
(NH3, Kb = 1.8 × 10⁻⁵) with 0.500 M hydrochloric acid (HCl).- Calculate the volume of HCl solution you will need to reach stoichiometric equivalence.
- Calculate the pH at the equivalence point. Remember, at this point all of the NH3 has been stoichiometrically converted into NH4+ and the volume of solution will have increased as well.
- Use the table of pKa values from the introduction to choose an appropriate indicator for this titration.
- There is a special point in a titration that is worth recognizing: the half-way point.
- Calculate the pKa of acetic acid.
- Calculate the volume of NaOH solution needed to reach the point in the titration when the number of moles of NaOH will be exactly half of the total needed to reach equivalence with the number of moles of CH3COOH in 25.00 mL of 0.500 M solution.
- Calculate the pH at this point in the titration. What makes this point special?
- Based on these calculations, make a similar calculation to find the pH at the half-way point in the titration of 25.00 mL of 0.500 M NH3 solution with 0.500 M HCl solution.
Safety
The following list does not cover all possible hazards, just the ones that can be anticipated. Move slowly and carefully in the lab: haste and impatience have caused more than one accident.
- If you choose not to wear safety glasses you are choosing to sit out the lab.
- All solutions used in this lab are mildly corrosive and will cause irritation on the skin, in the eyes, or on other body tissues. Handle with care.
- Phenolphthalein is only soluble in alcohol so the solution is flammable. Keep away from sparks, flame, or heat sources.
- Wash hands after handling all chemicals.
- If there are any chemical spills clean up with plenty of fresh tap water.
Procedure
- Before you begin you must complete the calculations in the pre-lab. They will prepare you by letting you know what to expect from the data you collect and what indicator to use in each titration.
 Calibrate your pH meter using the Vernier software. Solutions buffered at a pH of 7.00 and 4.00 (or 10.00) have been provided to you by your instructor. Carefully rinse the pH meter with deionized water and allow excess liquid to drip off before switching from one solution to another.
- Acetic Acid Titrated with Sodium Hydroxide: At your lab table there should be two lab groups. One group will set itself up to perform the titration of acetic acid, the other to perform the titration of ammonia. If you are in the latter group, read the instructions below marked with bold text. After you have performed your first titration you will switch burets with the other group at your lab table in order to save the time that would otherwise be used washing the buret in order to switch from NaOH to HCl. Be sure to refill the buret you obtain from the other group at your lab table.
- Get about 30 mL of acetic acid in a small beaker; use a volumetric pipet to measure exactly 25.00 mL of the acetic acid into a 250-mL beaker.
- Fill your buret with the sodium hydroxide solution your teacher has provided. Only fetch enough to fill the buret, about 50 mL. Fill to above the 0.00 mark then drain some out to fill the tip. Mark your initial volume on your lab handout. (Most data will be collected directly in the Vernier software but this starting value is important).
- Set your beaker on a magnetic stirrer and place a stir bar in the beaker.
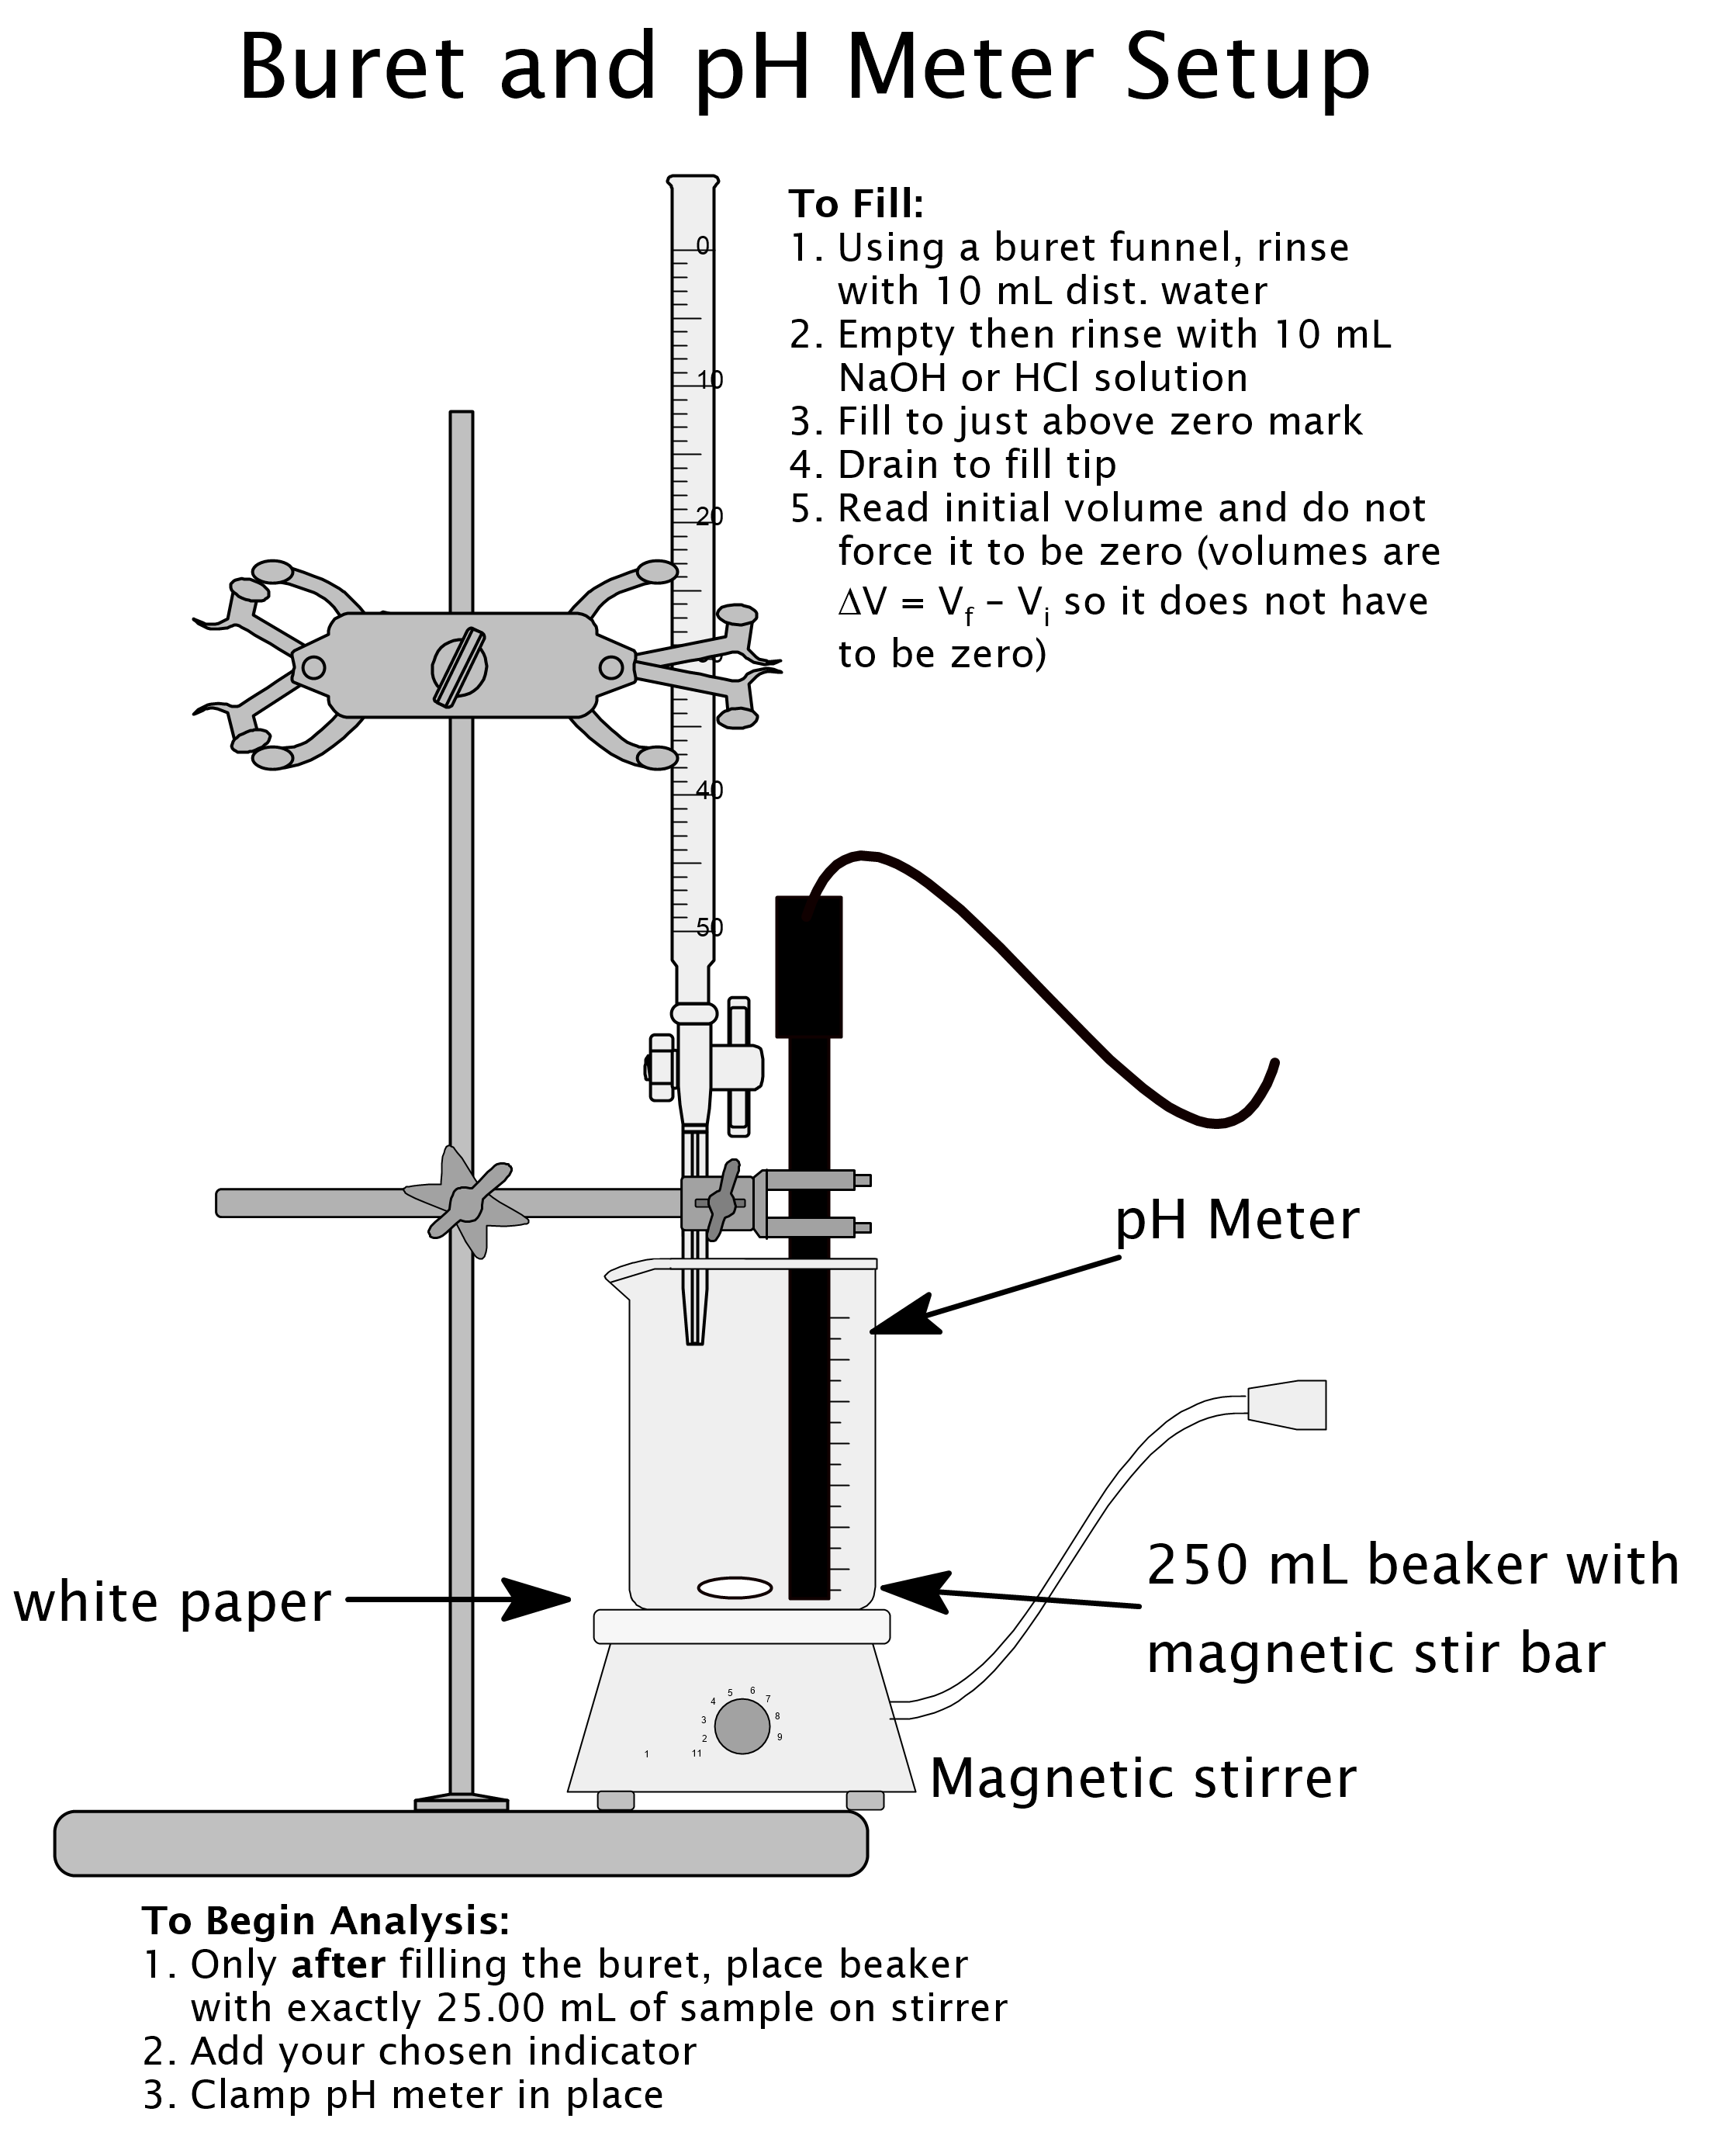
- Clamp your pH meter so that the probe is just above the bottom of the beaker containing the acetic acid. Be sure it will not be struck by the spinning stir bar. Add two drops of the indicator your calculations have shown you should use for this titration. Set the whole thing under the tip of the buret so you can easily add liquid from the buret without splashing. Start the stirrer to gently mix the solution.
- Use the Vernier software to record your data using the Events with Entry mode, starting with the pH at zero volume added. You will need to enter the total volume delivered up to and including each point at which you record the pH. This will require some calculations on your part. You may use your lab handout to help you but remember to subtract correctly to be able to enter the data correctly. For example, your first few data points might be: 0 mL, 1.00 mL, 2.04 mL, 2.92 mL, … None of these numbers are read directly from the buret: all volumes are calculated by difference.
- You will have calculated the volume needed to reach equivalence and you will know the pH to expect at equivalence from your calculations. When you get close, measure pH with smaller volume increments between successive measurements. Roughly speaking, switch from approx. 1 mL increments to approx. 0.20 mL increments when the change in pH for 1 mL added is 0.3 or more.
- Increase the increments of the volume added once you are two milliliters past equivalence. Keep adding liquid from the buret in 1 mL increments. The total volume you add should end up being about twice the volume needed to reach equivalence.
- Finish the titration, store the data in Vernier. Save the Vernier file to your personal drive in case the data you export get lost.
- Copy and paste your data into a spreadsheet and then follow the instructions in the post-lab to format the X-Y scatterplot you will make using the data.
- Ammonia Titrated with Hydrochloric Acid: for this titration you will be following the same instructions as above but instead of filling the buret with sodium hydroxide solution, you fill it with hydrochloric acid solution. You will measure out 25.00 mL of ammonia solution, rather than acetic acid solution. You will use a different indicator than with the acetic acid titration. If you are doing this titration after completing the one with acetic acid remember to refill the buret you have obtained from the other group at your lab table with hydrochloric acid solution.
- Disposal and clean-up: all solutions used in this lab may be washed down the drain with plenty of running water. Please clean all of your glassware, being especially careful to rinse many times.
Post-lab
Answer all of the pre-lab questions. Keep your calculations brief: only show the initial set-up and result for each calculation. Include them in the same document as your answers to the following questions.
- Give your answer to all of the pre-lab questions. Type them and format them for easy reading. Just give the set-up and results for calculations, please.
- Why is the color-change range of an indicator based on its pKa so that the range is: pH = pKa ± 1?
- Which calculation do you need to perform in order to select the correct indicator for each titration? Explain in one or more complete sentences.
- Provide a graph of the titration of acetic acid with sodium hydroxide with volume of NaOH added on the x-axis and pH on the y-axis. The graph should be an X-Y scatterplot created with a smooth curve, rather than individual data point. Add labels to the graph showing:
- Equivalence Point
- Range of pH Corresponding to Indicator Color Change
- Buffering Region
- Excess Titrant
- Create and provide a similar graph with all of the same features labeled for the titration of ammonia with hydrochloric acid.
- Consider the possibility that the pH meter was inaccurate. How would the indicator have helped you to discover this fact?