The differential rate law of a chemical reaction relates the rate of the reaction in M/s to the concentration of the reactants raised to various exponents called orders of reaction. For a generalized reaction of A with B the rate law will have the form:
Rate = k[A]n[B]mIn this equation k is the rate law constant which makes the proportion into an equation. The rate law constant varies with temperature and all experiments in this investigation will be carried out at constant temperature. The exponents n and m must be determined experimentally. In this investigation you will determine the values of these exponents and therefore define the rate law for the following chemical reaction:
2I–(aq) + 2Fe3+(aq) --> I2(aq) + 2Fe2+(aq)By varying the concentrations of iodide and iron(III) ions in solution and measuring the effect on the rate you will be able to determine the order of reaction with respect to each reactant and determine a and b in the following equation:
Rate = k[I–]a[ Fe3+]bThe task in this lab is to determine the values of a, b, and k. We will do so by using the method of initial rates. This works by comparing rates of reaction for different initial concentrations of reactants. By doing three experiments with carefully chosen initial concentrations it is possible to mathematically isolate the exponents. Once the exponents, or orders of reaction, are known for both reactants the value of k may be calculated from the known rate and known initial concentrations.
The formation of elemental iodine in this reaction makes it possible to measure the progress of the reaction spectrophotometrically. The iodine absorbs light at 450 nm so when the absorbance of the solution is measured as a function of time the rate of the production of iodine can be indirectly measured. By graphing absorbance vs. time a straight line is produced, the slope of which is proportional to the rate of the reaction. Recall that when Beer’s Law applies, concentration is directly proportional to absorbance. By plotting absorbance on the y-axis and time on the x-axis the slope will have units of absorbance over time. Since we do not have measurements of the proportion between concentration and absorbance we cannot measure the rate of reaction directly in this lab.
Absorbance Measurements
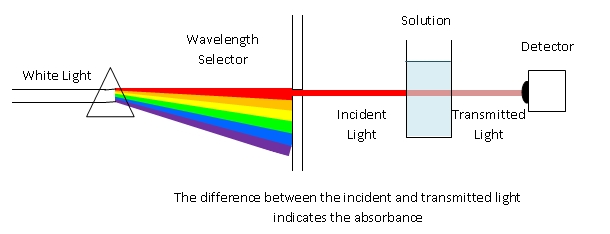
General Spectrophotometer diagram | 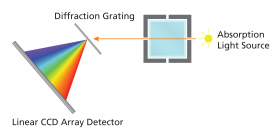
Vernier SpectroVis Instrument diagram |
Colored chemicals absorb specific wavelengths of light. Yellow food color absorbs blue light very strongly. Blue food coloring absorbs red and orange light. This can easily be demonstrated using a spectrophotometer or with an overhead projector and a diffraction grating.
Absorbance of light at a particular wavelength can be used to measure the concentration of colored chemicals. The larger the concentration of a colored chemical, the darked the color, and the stronger the absorbance. The mathematical definition of absorbance is based on the percentage of light that is transmitted. To make a measurement, the brightness of the light source is measured with no sample or with a so-called blank. This provides the initial intensity. Once a sample is placed into the spectrophotometer the intensity of light at the chosen wavelength can be measured, which is reduced compared to the blank. The ratio of these intensities, expressed as a percent is called the percent transmittance. As a function of concentration the percent transmittance does not produce a linear relationship. By taking the negative log10 of the transmittance (expressed as a decimal) the absorbance may be calculated (A = -log(%T)). This calculation is performed automatically by the instrument. The absorbance is a measure of the amount by which a chemical has reduced the intensity of light. The higher the absorbance, the more strongly the light is absorbed. Absorbance has a simple, linear relationship to the concentration of a chemical and so it can be used to measure concentration. If measured as a function of time, absorbance provides a measure of changes in concentration. This is how we will use the instrument.
Measuring Rate of Reaction
We will not attempt to collect data which directly connects absorbance to concentration but since they are directly proportional the rate of change of the absorbance will serve perfectly well to stand in for the true rate of reaction. The slope of a graph of absorbance (y-axis) vs. time (x-axis) will have units of A/s. When measured at 450 nm the absorbance increases as the reaction
 under study progresses. The reaction rate slows down as products build up and so it is not a constant with a simple linear appearance on the graph. In order to compare rates between experiments we will find an average rate of reaction by using the analysis software to perform a linear regression over a chosen interval (for example, from 10.0 s to 60.0 s)
In the sample data displayed at right the slope is about 4.4 × 10⁻³. This is the only number we need from the many data points you will collect. You will perform a given experiment three times, discard any trials which you know are poor data (based on your execution), and average the trials to find a rate of reaction for that experimental setup.
Given how rate is determined in these experiments a true value for k, the rate constant, cannot be calculated exactly. In order to be able to calculate a value we will be taking the rates determined here to be in units of M/s rather than A/s.
One additional note about the data students are collecting. The experimental design will produce data allowing the student to compare the initial (or average) rate for different initial concentrations. This is a rate vs. concentration, or differential rate law experiment. The data collected using this procedure cannot be analyzed on a concentration vs. time, or integrated rate law, basis. This is because the concentration of both reactants is comparable and both will vary over the course of data collection. In order to collect data suitable for analysis according to the integrated rate law the procedure would need to set up trials in which one reactant had an essentially constant concentration. This could be accomplished by making one concentration 1,000 times larger than the other. In that way, the reactant with the small concentration would be the only reactant concentration that is changing.
Calculating Order of Reaction
To find order of reaction you will use data from two experiments. Use the average rate and the calculated initial concentrations of reactants.
Experiment 1 Concentration of I–
(vol. of KI soln) 1.0 mL
                  ------ × 0.020 M = 0.0067 M
(total volume)    3.0 mL

Experiment 3 Concentration of I–
(vol. of KI soln) 2.0 mL
                  ------ × 0.020 M = 0.013 M
(total volume)    3.0 mL

Experiment 1 and 3 Concentration of Fe3+
(vol. of FeCl3 soln) 1.0 mL
                     ------ × 0.020 M = 0.0067 M
(total volume)       3.0 mL
|
Rate = k[Fe3+]a[I–]b Rate1 = k[0.0067]a[0.0067]b --------------------------- Rate3 = k[0.0067]a[0.013]b 5.6 × 10–3 = k[0.0067]a[0.0067]b ---------------------------------- 1.1 × 10–2 = k[0.0067]a[0.013]b 0.5 = k/k × 1 × (0.5)b so b = 1 since only 0.51 = 0.5 |
Practical Matters
You will use syringes to measure volumes. Do not use syringes in the bottles of stock solution to avoid possible contamination. Obtain about 10 - 12 mL of each solution in a separate, labeled beaker. Draw some solution into the syringe and then expell it in order to exclude air bubbles. Fill the syringe to a larger volume than what you need. Deliver the amount you need by difference between two points on the scale on the side of the syringe. For example, deliver 1.0 mL by pressing the plunger down so that it moves from 3 mL to 2 mL.
Use a different, clean cuvet for each experimental setup. Between trials carefully clean the cuvet and make it as dry as possible so that you do not affect the outcome of the next trial.
Objective
Determine the rate law for the reaction under investigation by collecting rate vs. initial concentration data.
Materials
- spectrophotometer capable of providing absorbance at 450 nm
- 4 cuvets
- distilled water
- 0.020 M potassium iodide (KI) solution
- 0.020 M iron(III) chloride (FeCl3) solution
- syringes for measuring solutions
Safety
The following list does not cover all possible hazards, just the ones that can be anticipated. Move slowly and carefully in the lab: haste and impatience have caused more than one accident.
Always leave stock solution bottles tightly closed when not in immediate use!
- Both stock solutions used in this lab experiment are dilute and so are relatively safe to use. As always, wash hands before leaving the lab, eating, or drinking, or going to the bathroom.
- Wear chemical splash goggles, gloves, and a chemical-resistant apron.
- Iron(III) chloride is a skin and tissue irritant; it is corrosive and toxic (LD50 = 260 mg/kg), and causes stains. Use care in handling the solution.
- Potassium iodide (KI) is non-toxic.
- The iodine (I2) produced in the reaction is corrosive and toxic but is produced in minute amounts in this lab and so is of minor concern.
- All solutions used in this lab must be collected for hazardous waste disposal. Neither the elemental iodine nor the iron(II) or iron(III) ions may be dumped into the sewer system.
Collect all waste in the designated bottle by pouring the solution out of the cuvet, rinsing the cuvet by filling it once with tap water and pouring it into the bottle, and the closing the bottle again. Use the funnel provided to make splashing outside the bottle less likely.
| Experiment Number | Volume Distilled H2O (mL) | Volume 0.020 M KI (mL) | Volume 0.020 M FeCl3 (mL) |
| 1 | 1.0 | 1.0 | 1.0 |
| 2 | 0 | 1.0 | 2.0 |
| 3 | 0 | 2.0 | 1.0 |
Procedure
- Pick up a cuvet by touching the grooved sides. Handling the smooth sides will put fingerprints on it which could have a small effect on the data collection. Prepare a blank solution by mixing 1 mL KI solution with 2 mL distilled water in a cuvet. Place it into the spectrophotometer with the flat, smooth sides facing the white circle and triangle.
- Plug the SpectroVis Plus unit into the USB port of the computer and start “Vernier Spectral Analysis”. The older software was called Logger Lite (or Logger Pro), so the software may vary depending on the computer you use).
- You will be prompted to choose an experiment type: choose Absorbance vs. Time (Kinetics).
- You will be prompted to choose a wavelength for analysis: enter 450 nm.
- Calibration is required in order to establish the brightness of the lamp with no sample. All absorbance measurements are made by reference to this calibration. A dialog box will pop up to inform you that the lamp is warming up. Do not skip this step, it only requires 90 seconds. Make sure the cuvet containing the blank solution is in the device. Then click “Finish Calibration” and it will be ready to collect data.
- The default is to collect data at a data point every two seconds for 200 seconds. This can be changed in the options for the experiment. Collect one data point per second for 120 seconds, if available. At any rate, choose the shortest available interval between data points. You will not need more than two minutes of data.
- Using the quantities in the table at right perform three trials for each set of quantities.
- To run a trial start by mixing water and KI solution in the cuvet. Have a syringe filled with FeCl3 ready to deliver the needed volume. When ready, add the iron(III) chloride solution by measuring by difference, cap the cuvet, shake vigorously, and place the cuvet in the spectrophotometer.
- Immediately begin data collection by pressing the ’Collect‘ button. Try to perform these actions as repeatably as possible so that data collection always begins after the same delay to measure the FeCl3 solution, the same amount of shaking, and the same time before placing the cuvet in the device.
- Click the STOP button or wait until data collection stops automatically. By clicking and dragging on the graph you can select an interval of your data. In the menu that pops up (or click the three dots you will see) choose “Apply Curve Fit”. Then confirm Linear. You will need only the value next to the letter ‘m’, which is the slope calculated for the linear regression. Write this slope down for every trial, as this is the only information you need from each trial. It is the rate of reaction in absorbance units per second.
- You may need to adjust the interval over which you measure the rate. Skipping a few seconds at the start is a good idea because being perfectly consistent at the start of each trial is unlikely. Taking too long an interval will average rate over too much time, making it harder to distinguish between experiments. Ideally, the interval you choose should be approximately the rate just after you started collecting data. Try invtervals of 20 - 50 s total, probably starting at the 5 s or 10 s mark.
- Write down all the slopes (rates) for each experiment. You will find an average rate for the trials for each experiment and it is this average that you will use in your calculations and analysis.
- Be sure to collect at least three trials for each experimental setup. Repeat trials, if necessary, but it is not worth taking the time to do more than 4 trials for any of the experiments.
- When you are finished, tidy your lab station. Package up and put away the spectrophotometer. Dispose of solutions properly. Wash glassware with soapy water. Clean cuvets with only clean water. Do not use soap because they are very hard to rinse out.
Analysis
Perform the following calculations and answer the following questions. Some questions are specific to your lab data and results and some are more general and probe your knowledge of the concepts central to a deep understanding of chemical kinetics.
Part I: The following questions are generalized questions about chemical kinetics and do not depend on data collected in the course of carrying out your lab work:- Mathematically speaking, how does the reaction rate depend on the concentrations of the reactants? In other words, as concentration increases, what happens to the rate?
- Why does the reaction rate change as you alter the experimental conditions by changing the initial concentrations? Give an answer by referring to events at the molecular level.
- What is the difference between the reaction rate and the rate constant?
- What is the effect of a catalyst on the measured rate of the reaction? How does a catalyst affect the activation energy of the reaction? Why does it have this effect?
- What effect does a catalyst have on the rate constant?
- Why is the reaction rate dependent on the temperature at which the reaction takes place?
- Describe the process you used in order to measure the rate of reaction for each of your trials. Use no more than 2 or 3 sentences.
- Provide a small data table showing the values of the slope for each trial and the average. Do not give data tables for all of the spectroscopic data for even one trial!
- In your own words, briefly describe how this lab was designed to provide the data you needed to be able to determine the order of reaction of each reactant and to be able to write the differential rate law.
- In this lab we worked on finding the differential rate law. What kind of data would we have needed if we wanted to determine the integrated rate law?
- Calculate the order of each reactant. Show one sample calculation for each reactant.
- Using initial concentrations calculate the rate constant for this reaction. Take the slope of your graphs to be the rate in M/s. (It isn’t but it is proportional to the rate). Is the rate constant the same (or at least close) for all your experiments?
- From the data in the lab it is not possible to calculate the value of the rate constant directly using molar concentration. Explain what other data you would need in order to do this.
- What is the differential rate law for this reaction? Write it in the form: Rate = k[I –]a[Fe3+]b. You must give the values of k, a, and b. The units of k must be included.
- Comment on the reliability of your data. Were your experiments consistent for a given set of initial conditions? If not, why not? Discuss.
- When you found the slope of the graph were you calculating an instantaneous rate or an average rate? Justify your answer.
- How could you change the experiments to improve the data?