Group Activity: Graphing Direct
and Inverse Proportions
There is a spreadsheet with the data from this activity, including graphs.
Note: For beginning students it may be prudent to only use the first half of this activity, which is concerned with direct proportions. The section about inverse proportions could be saved for a future date to precede a lesson about the pressure-volume law for gases.
Introduction
Mathematical relationships between variables are very useful in science because they make it possible to make quantitative predictions about the world. The simplest kinds of relationships are called proportions. In a proportion, when one variable changes the related variable changes by a fixed amount. In this activity you will be exploring two kinds of proportions: direct and inverse. You may work in small groups on this activity and share the labor of producing the necessary graphs. However, the final question requires every individual to make her or his own graph(s).
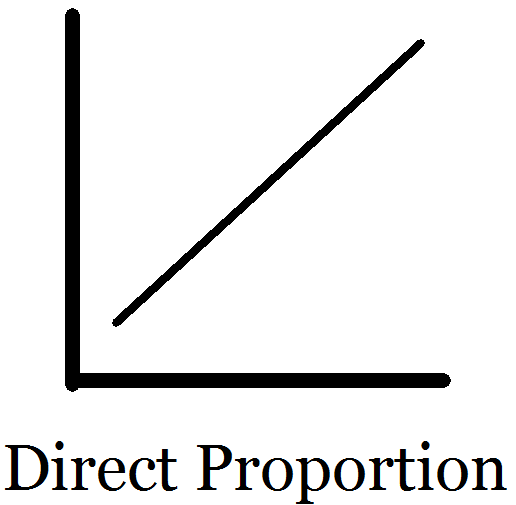
Direct Proportion
For a fixed amount of gas in a rigid container, the pressure of the gas is directly proportional to the absolute temperature.
In order for a correct mathematical description of this proportion to be written it is necessary to have an absolute scale of temperature with no negative values. The lowest possible temperature is known as absolute zero and on a special temperature scale, called Kelvin (K), the numerical value is 0 K. Degrees on the Kelvin scale are the same size as degrees on the Celsius scale. In degrees Celsius, water freezes at 0°C. Absolute zero on the Celsius scale is –273°C.
There are a wide variety of units to measure gas pressure. A common scientific unit used to measure it is the kilopascal (kPa). Normal air pressure at sea level on the Earth is about 15 pounds per square inch, or 101 kPa. Data relating temperature in kelvin (K) and pressure in kilopascals (kPa) in a container with a constant volume are provided below.
Temperature (K)
x-axis
Pressure (kPa)
y-axis
100
166
200
332
300
500
400
665
450
749
Read through the text just above the data table. Which of the temperatures in the table is closest to the normal freezing point of water, which is 0°C? Justify your answer.
Use a piece of graph paper to make a graph of the data in the table. Arrange the axes of the graph so that the data are spread over the as much of the page as possible. Plot points as precisely as possible.
Use a ruler to draw a straight line so that the line passes as close as possible to all of the points.
Select two points on the line (but not data points) and record their x and y values.
Point 1 (x1, y1):
Point 2 (x2, y2):
Use the two points you selected to calculate the slope (m) of your line (y = mx + b). Report the result in decimal form and include the appropriate units.
     (y2 - y1)
m = ——————————
     (x2 - x1)
Consider what the value of the slope allows you to do. Multiply any two temperature values from the data table by the slope. Show your work. What do you notice about the results?
Is the slope the same for each point on the line, or does it keep increasing? If something is increasing, what is it?
Determine the y-intercept (b) of your line (y = mx + b). For the values of x and y use the values of x and y from one of the two points your recorded earlier. For the value of m, use the slope you calculated in a previous questions. Report the value of the y-intercept with appropriate units.
Consider the data in the table and answer the following questions:
What happens to the pressure when the absolute temperature is doubled?
What happens to the pressure when the absolute temperature is cut down by a factor of four?
There are two ways to use this graph to calculate values of pressures for a given temperature.
First, you may take a temperature value, plot it on the line, and use a ruler to help you to read the corresponding value of pressure from the y-axis. Use this technique to find the pressure that corresponds with these temperatures:
275 K
350 K
425 K
Second, you may write an equation (y = mx + b) for the line based on the slope (m) and y-intercept (b) you found above. Once you have written the equation, plug in a value for temperature as ‘x’ and calculate the pressure. Use this approach to find the pressure that corresponds with these temperatures:
150 K
325 K
500 K
Generally speaking, when a variable’s value increases in a direct proportion, what happens to the value of the other variable? How is the amount of change deteremined?
Write a definition of a direct proportion based on your experience with the data in this exercise.
page break
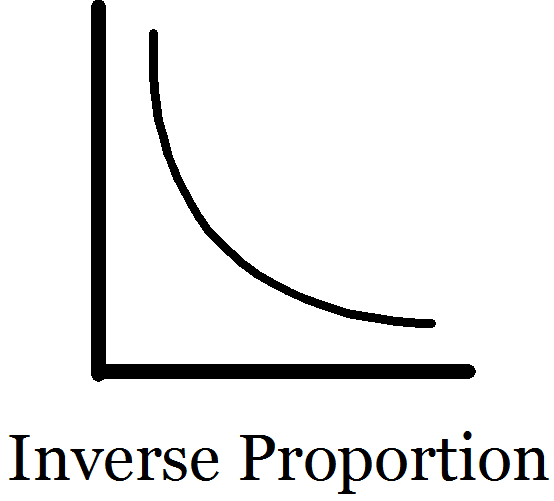
Inverse Proportion
The faster you travel, the sooner you arrive. This is clearly demonstrated in the data given below, which shows how the time it takes to travel a fixed distance decreases as the speed increases.
Travel Time (s)
x-axis
Speed (m/s)
y-axis
Inverse Travel Time (1/s) second x-axis
12.0
1
3.0
4
1.5
8
1.0
12
0.5
24
Use a piece of graph paper to make a graph of the data in the table. Arrange the axes of the graph so that the data are spread over the as much of the page as possible. Plot points as precisely as possible. Do not connect the dots and do not draw a line of best fit.
Observe the form of this graph, which is not a straight line. Draw a rough curve that follows your data points on your graph. In science we wish to define relationships as clearly as possible. Curves such as the one you see are not always immediately identifiable with a single equation. For example, consider the following three graphs. They look very similar but they are based on different equations. Can you identify which equation goes with which graph? Write down your guesses.
In order to clearly identify a simple inverse proportion scientists use a simple technique and you can do it, too. If the relationship is a simple inverse proportion then plotting 1/x vs. y instead of x vs. y will give a graph of a straight line. This is justified by the following simple algebra:
Equation of an inverse proportion: y = k·1/z
Given: y = k·1/z (to turn this into a direct proportion, substitute 1/x for z)
y = k·1/(1/x) (next we simplify the resulting equation)
y = k·x
Here is how to check your data to see whether it is a simple inverse proportion:
Calculate the inverse of each travel time value to three significant figures.
Then create another graph, plotting the inverse time values (in units of 1/sec) on the x-axis and the speed values on the y-axis. Arrange the axes of the graph so that the data are spread over the as much of the page as possible. Plot points as precisely as possible.
Draw a line of best fit: Use a ruler to draw a straight line so that the line passes as close as possible to all of the points.
Select two points on the line (but not data points) and record their x and y values.
Point 1 (x1, y1):
Point 2 (x2, y2):
Use the two points you selected to calculate the slope of your line. Report the result in decimal form and include the appropriate units. In this case you will need to simplify the units since the same unit appears in both the y-value and the x-value.
     (y2 - y1)
m = ——————————
     (x2 - x1)
What is the meaning of the slope of this line? In other words, what does it physically represent based on its units and the fact that it relates speed and travel time?
Determine the y-intercept (b) of your line (y = mx + b). For the values of x and y use the values of x and y from one of the two points your recorded earlier. For the value of m, use the slope you calculated in a previous questions. Report the value with appropriate units.
What is the physical meaning of the y-intercept? Use the units to help you to figure it out.
Consider the data in the table and answer the following questions:
What happens to the travel time when the speed is doubled?
What happens to the travel time when the speed is cut down by a factor of three?
There are two ways to use a graph to calculate values of travel time for a given speed, or vice versa.
First, you may take a speed value, plot it on the curved graph, and use a ruler to help you to read the corresponding value of travel time from the x-axis. Use this technique to find the travel time that corresponds with these speeds:
3 m/s
10 m/s
18 m/s
Second, you may write an equation for the line (y = mx + b) based on the slope (m) and y-intercept (b) you found above. Once you have the equation, plug in a value for the inverse of the travel time as ‘x’ and calculate the speed. Use this approach to find the speed that corresponds with these travel times:
15.0 s
8.0 s
4.0 s
Generally speaking, when a variable’s value increases in an inverse proportion, what happens to the value of the other variable? How is the amount of change deteremined?
Write a definition of an inverse proportion based on your experience with the data in this exercise.
Both direct and inverse proportions involve a quantity called the ‘constant of the proportion’. Based on your work in this activity, what does this phrase mean?
Identify and give the values, with units, of the constants of the proportions you explored in this activity.
At a constant temperature for a fixed amount of gas, the pressure is proportional to the volume of the gas. Use the data below to determine whether the relationship is a direct or an inverse proportion. Be prepared to provide one or more graphs to provide evidence for your conclusion. Produce an equation which expresses the proportion including a constant with appropriate units. If you are comfortable using such tools, feel free to use a computer with appropriate software to graph and analyze the data. You could even copy the data from this page online and paste it into your software. Each individual student must make her or his own graph(s) for this question.
Pressure (atm)
Volume (L)
0.25
89.6
0.5
44.8
0.75
29.9
1
22.4
1.5
14.9
3
7.5
Here is some graph paper that students can use to do the activity.