Vernier SpectroVis Instrument diagram
In this experiment you will determine the numerical value of the equilibrium constant for the reaction:
This will be accomplished by measuring the equilibrium concentration of the blood-red metal-complex ion iron(Ⅲ) thiocyanate (FeSCN2+) with five different initial concentrations of iron(Ⅲ) (Fe3+) and thiocyanate (SCN–) ions. The value of the equilibrium constant is calculated using the equilibrium constant expression:
| Keq = | [FeSCN2+] |
| [Fe3+][SCN–] |
The value calculated for Keq will be the same, within experimental error, for a variety of different concentrations of the reactants and product.
The technique used to measure concentrations in this experiment is spectrophotometry. Since iron(Ⅲ) thiocyante is blood red in color (though its solutions at low concentration appear orange) it absorbs light strongly at the blue end of the visible spectrum. Specifically, its wavelength of maximum absorption is 450 nm. You will use absorption at this wavelength to find the equilibrium concentration of FeSCN2+. By subtraction you will calculate the concentration, at equilibrium, of Fe3+ and SCN–. Because the stoichiometric ratios are 1:1 the concentration of the product is the exact amount by which the concentration of each reactant will be reduced. For example, if the measured concentration of FeSCN2+ is 9.00 × 10⁻⁵ M and the initial concentrations of Fe3+ and SCN– are [Fe3+]0 = 1.00 × 10⁻³ M and [SCN–]0 = 8.00 × 10⁻⁴ M then the equilibrium concentrations will be:
This gives a value for Keq of:
| Keq = | (9.00× 10⁻⁵) | = 139 |
| (9.10 × 10⁻⁴)(7.10 × 10⁻⁴) |
This value is similar to typical values usually found in carrying out this experiment. Note that although the value of Keq will be about the same (a typical result is about a 15% variation) the concentrations of reactants and products can be different. Each different set of equilibrium concentrations is called an equilibrium position.
|
Vernier SpectroVis Instrument diagram |
This experiment depends on careful measurements of the concentration of the colored complex ion’s concentration. The initial concentrations of the reactants are determined by the dilutions that take place when they are mixed. If the concentration of FeSCN2+ is known, then stoichiometry (see calculations above) can easily find the equilibrium concentrations of the reactants. The question then is, how do we measure the concentration of FeSCN2+?
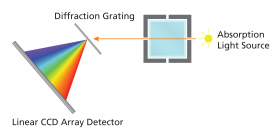
The answer is spectrophotometry. A spectrophotometer is an instrument that measures the intensity of light after it is passed through a colored solution. In order to use it the intensity of the light source in the instrument is measured with a colorless solution. The intensity of the light after passing through the colored solution is then compared with this ‘blank’ measurement to calculate the amount of light absorbed, known as the absorbance. A diagram of the instrument used in your lab is at right.
A spectrophotometer can be used in a variety of ways. One way to use it is to generate an absorbance spectrum. This graphs the strength of light absorbance as a function of wavelength. The image below shows the absorbance spectrum of the FeSCN2+ ion. The graph shows a region of the spectrum with strong light absorbance centered on about 450 nm. The spectrum shows almost no absorption above about 650 nm. Since blue is absorbed and red is transmitted, the material has a red appearance to our eyes. Because it is the blue light that is absorbed, and because it is specifically the light at 450 nm that is most strongly absorbed, this is the wavelength of light that you will use to measure the concentration of FeSCN2+.
.Thiocyanate.Visible.Spectrum.png)
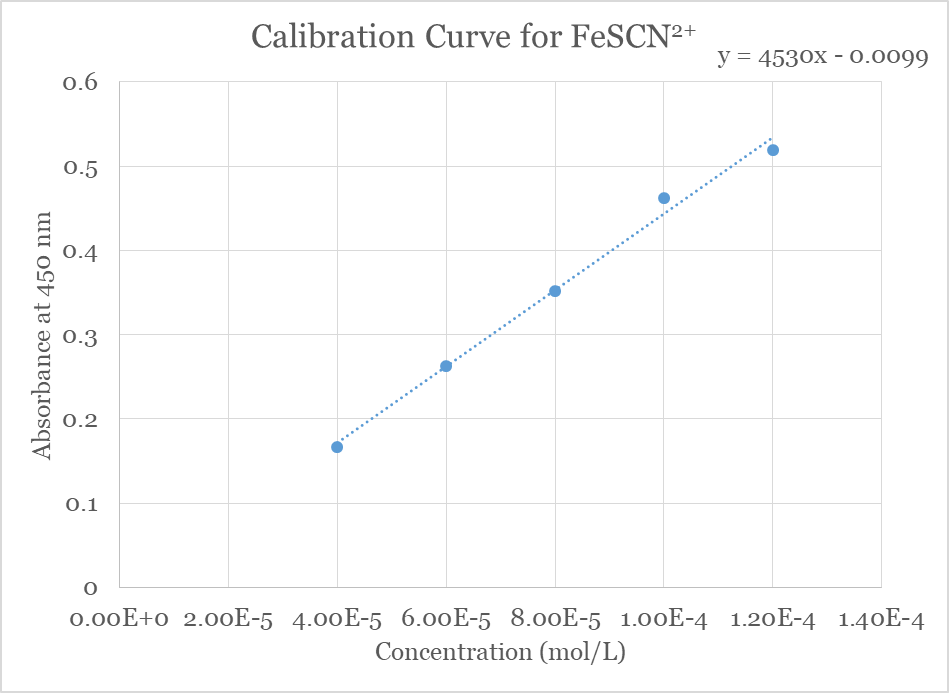
The absorption of light at a wavelength of maximum absorption (λmax) is directly proportional to the concentration of the colored substance. This proportion is known at Beer’s Law:
A = εbcIn this equation A represents absorbance (which has no units). The concentration in mol/L is c, the path length in centimeters is b (usually 1 cm), and ε (the Greek letter epsilon) represents the molar absorptivity constant in inverse molarity and inverse cm (M–1cm–1). This constant relates the
 | ||||||||||||||||||||||
The problem remains, however, of how to establish the concentration of a solution of FeSCN2+ independent of spectrophotometric measurements. It turns out to be quite straightforward. The idea is to arrange the concentrations of the reactants in such a way that regardless of the value of the equilibrium constant we can make a valid assumption about the concentration of FeSCN2+. This is done by putting Le Châtelier’s Principle into practice. Le Châtelier’s Principle is the idea that a system at equilibrium will respond to stresses placed on that equilibrium by changing reactant and product concentrations in such a way as to minimize the stress. For example, if the concentration of one reactant is increased then when a new equilibrium position is established the concentrations of both reactans will decrease while the concentration of products will increase. This uses up the added reactant and minimizes the stress on the equilibrium. In this experiment the series of five solutions with a known concentration of FeSCN2+ will be made by using a huge excess of Fe3+ ions and a very small concentration of SCN– ions. In this way the initial concentration of SCN– ([SCN–]0) is reduced effectively to zero at equilibrium and is stoichiometrically converted into FeSCN2+. This is illustrated schematically at right. The main idea can be expressed symbolically like this:
You will write and submit a formal lab report. For each section of your report be sure to include the following topics in the sections noted.
While giving a brief overview of the steps taken to complete the experiment, be sure to include the following:
Comment on the educational experience of carrying out this experiment.