In this lab students will learn about how light can be used to investigate matter. Molecules absorb some light and transmit the rest. By absorbing some light they cause some parts of the full spectrum of visible light to be dimmer than other parts. This changes visual perception of the material so that it takes on a certain color. A tool called a spectrophotometer can measure just how much light is absorbed at a variety of visible wavelengths. Students will quantify the absorption of light at different wavelengths for several kinds of food coloring. In addition, they will be introduced to the idea that concentration and absorbance are directly related.
Background
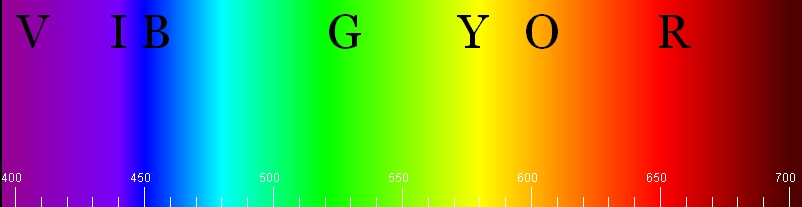
Figure 1
White light produced by the Sun, or by an incandescent light bulb, is really a mixture of all the colors of light in the visible spectrum. See Fig. 1. Our eyes and brains process this mixture of light and give us the perception of white. We see other colors when white light falls on objects that absorb some wavelengths of the spectrum but not others. Some colors of light are absorbed by the object and others are reflected or transmitted. Our eyes cannot pick up the absorbed light because it is gone; instead we see the reflected or transmitted light.
When a substance appears red to our eyes it means that light of that color has passed through the material unchanged or has reflected off of it. The other colors of light have been absorbed. The spectrum produced by passing white light through a prism or diffraction grating shows all the colors of the rainbow. A spectrum of light produced after passing the light through a red substance looks dark where the other colors should be but is bright at the red end of the spectrum. By using different colored solutions, an old-fashioned overhead projector with a mask covering all but a small rectangle, and a diffraction grating attached to the lens it is possible to demonstrate this process. Figure 2 shows approximately what red food coloring will do to the full spectrum of light when the light passes through a dilute solution of the food color. At the bottom of the image are all of the colors of white light. At the top of the image the black part shows the light that has been absorbed. The light part to the right shows the light that was transmitted. This is a visual absorption spectrum (plural: spectra) for red food coloring. See also this page at Barry Rice’s excellent web site: Absorption Spectra.
The upper part of the image shows a spectrum of light after passing through a red solution. All but the red light has been absorbed.
For comparison the lower part of the image shows the full color spectrum.
Figure 2
In this lab we will not be using the equipment to view absorption spectra directly. Instead, the spectrophotometer is designed to measure the absorption of light quantitatively. It does so by comparing the brightness of a beam of white light to the brightness of the same beam after it passes through a partially transparent substance. The spectrophotometer measures the differences in brightness and calculates an absorption. Absorption changes with different wavelengths of light and a graph of absorption versus wavelength is another way to view the absorption spectrum of a material.
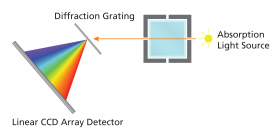
Figure 3
Figure 3 is a diagram of how the data are collected in the device you will use for this lab. It shows how a light source, which produces all wavelengths of light from the near infrared to the low-energy ultra-violet, shines through a sample. The sample interacts with the light, absorbing some wavelengths and allowing others to pass through. Next the light passes through a diffraction grating. This is a clear material with many very thin lines etched into its surface. It splits the combined light beam into a spectrum. This spectrum is projected onto an array of CCD detectors, which measure the intensity of each wavelength. The first step you will take is called calibration. Calibration is any process by which you establish the way in which a tool will measure something. In this case it involves shining light through a blank solution, one with nothing dissolved in it. By collecting data on the intensity of light over the whole spectrum with a blank solution the device can compare this intensity to the brightness of light after it passes through a test solution.
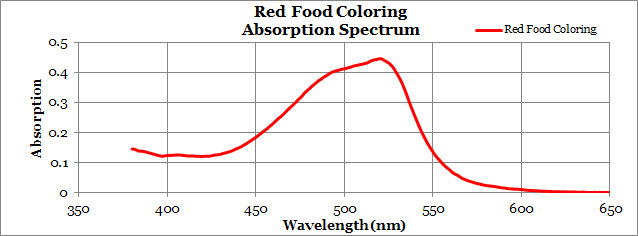
In the graph displayed in Fig. 4 the absorption of light is plotted against wavelength. The graph shows that light in the range from about 450 nm to 550 nm is strongly absorbed and moderately absorbed below 450 nm. Light with a wavelength longer than about 600 nm is not absorbed at all. Since the visible spectrum appears red to our eyes above 600 nm the solution with red food coloring in it appears red.
Figure 4
Finally, the concentration of the colored molecules affects how strongly light is absorbed. If you use one drop of food coloring in a 100 mL of water you will see the absorbance curve as shown above. If you use more than one drop then the graph will have the same shape but it will have higher values for the measured absorption of light at all wavelengths. It is possible to use data relating absorption and concentration to measure the concentration of solutions by measuring absorbance.
Pre-Lab Questions
Before handing this lab in, write your answers to these questions.
What is meant by the phrase “full spectrum light”?
How do colored transparent materials affect full spectrum light that passes through them?
If a material absorbs red light and violet and blue light then what color would you expect it to appear? Why?
What does a visual absorption spectrum tell you about a substance?
How does a spectrophotometer create a quantitative absorption spectrum?
The graph of the absorption spectrum of red food coloring is displayed in the background information in this lab. Interpret this graph in order to explain why red food coloring appears red. The peaks on the graph show wavelengths that do not pass through the solution.
Sketch a prediction for the graph of the absorption spectrum of blue food coloring. Consider that the graph should be high for parts of the spectrum where little or no light passes through. It should be low where the colored light can pass through. Write a sentence or two explaining why you made the graph with the peaks and valleys you chose.
page break
Materials
Computer with Vernier software
Vernier SpectroVis Probe
cuvets with covers
set of four food colors
250-mL beakers
100-mL graduated cylinder
50-mL graduated cylinder
disposable beral-type pipets
Safety
The chemicals used in this activity are all of negligible toxicity and are used in dilute solutions. Even so, it is best to wear standard laboratory safety equipment such as splash goggles and long pants. Tie back long hair and do not wear dangling jewelry in the lab.
Part I:
Procedure
In this part of the lab you will collect data showing the absorbance of light at a range of wavelengths by four different colors of food coloring.
Mixing the Test Solutions
Obtain a 100-mL graduated cylinder and 4 250-mL beakers. Place exactly one drop of red food coloring into one beaker. Place a drop of green in the next, a drop of blue in the next, and a drop of yellow in the last. Try to make the drops all the same size.
Measure 100 mL of tap water and add it to one of the beakers. Add 100 mL of water to each of the other beakers, too. This should mix the food coloring competely with the water.
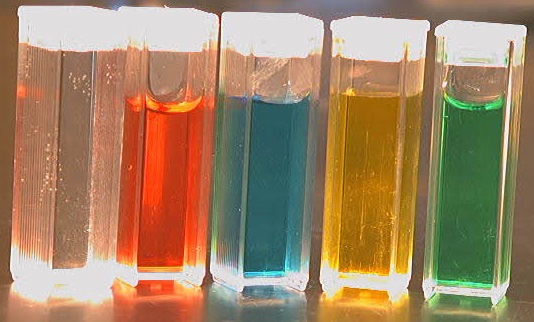
Here is an image of what the cuvets looks like when filled with the solutions prepared as described in the procedure below. This image will not print with the lab handout.
Collecting Data
Plug the SpectroVis Plus unit into the USB port of the
computer and start the Logger Lite or Logger Pro software.
Or if you are using a Chromebook, use the search function
to find “Vernier Spectral Analysis”.
Calibrate the Spectrometer by finding this function in
your software. This step is critical because it provides
the baseline for brightness measurements to determine the
absorption of light.
A dialog box will pop up to inform you that the lamp is
warming up. Do not skip this step, it only requires 90
seconds.
Once Calibration is complete, click OK.
Pick up a cuvet by touching the grooved sides. Handling the smooth sides will put fingerprints on it which could have a small effect on the data collection. Fill a cuvet with tap water and place a cap on it. Place the cuvet into the SpectroVis device so that the smooth sides face the white circle and white arrow. Once warm-up is complete, click “Finish Calibration”.
Once Calibration is complete, click OK.
Click on the “Experiment” menu again, select “Set Up Sensors” and click on the word Spectrometer.
In the dialog box that pops up change the “Wavelength Range” so that it begins at 400 nm and ends at 700 nm. Click the X to close the dialog box.
Click the “Wave” button at the top of the screen. Ensure that “Absorbance vs. Wavelength” is selected and then click OK.
Fill a cuvet with some of the red solution by using one of the disposable pipets. Place it into the SpectroVis with the clear sides facing the white icons. Click the “Collect” button at the top of the screen and wait for data collection to begin. It will complete in very little time. Click the “Stop” button at the top of the screen. Then click the “Store” button to save the data and prepare for the next run.
Repeat these data collection steps to collect the absorbance spectrum for blue, yellow, and green food coloring. If you do it in this order it will make it easier to compare with classmates.
Once you have stored all four data sets, save the Logger file in a place where you can access it again in the future. For example, save it to your desktop and then upload it to your school Google drive. You can only use the file with the Logger software (a free version may be downloaded).
Next, start Excel. In the Logger software select all of the numerical data using the mouse and paste these data into a spreadsheet starting in Cell A2. By removing the entire column, remove all duplicates of the wavelength data column except the one farthest to the left.
Add labels at the top of each column such as Wavelength (nm) and Red Color Absorbance. Label all columns.
Create a scatter plot graph of these data with a smooth line and no data markers. Put all four data sets on the same graph and select colors for each data set that match the color of the food coloring used to make the line. Format the graph to leave out blank areas by adjusting the x- and y-axis.
page break
Part II:
Procedure
In this part of the lab you will collect data to allow you to build a calibration curve according to Beer’s Law (A = εbc). This allows you to establish a direct proportion between the absorbance of light at a particular wavelength to the concentration of food coloring in percent. You will do this by measuring the absorbance of a series of standard solutions that you will mix up. The standards will all have known concentrations. The absorptivity constant (ε) is the constant of a direct proportion between the concentration of the solute and the absorbance at a particular wavelength. The letter b is the pathlength of the cuvet and is usually 1 cm so it does not affect the outcome of calculations.
The wavelength used for analaysis is selected based on the spectrum of the material being analyzed. The analysis wavelength must be one at which the substance has a strong absorbance.
Mixing the Test Solutions
For this part of the lab work with one other group (for a total of four people) to make the solutions. Work together and share the mixing tasks.
Choose either yellow or blue food color and make a solution using 2 drops and 200 mL of water, measured as accurately as possible. Use a 400-mL beaker or larger.
Obtain 5 250-mL beakers and label each one with a sharpie as follows: 100%, 75%, 50%, 25%, 10%.
You will now make a series of dilutions to make solutions with smaller concentrations. Your original solution has a concentration of 100% and it will be the first solution you use to generate your data. Make the second solution have a concentration of 75%. To make it, use 75 mL of the 100% solution mixed with 25 mL of water, measured as accurately as possible. Measure both as accurately as possible using graduated cylinders. Put the remainder of the 100% solution into the labelled beaker.
The third solution should have a concentration of 50%. Use 50 mL of the 100% solution mixed with 50 mL of water.
Make your fourth solution have a concentration of 25%. Use 50 mL of the 50% solution mixed with 50 mL of water.
The fifth solution should have a concentation of 10%. Mix 20 mL of the 50% solution with 80 mL of water.
Using different beral pipets for each solution, fill a set of cuvets with samples of each concentration. Cover the cuvets and wipe them dry. To keep them straight set them on a piece of paper labelled in different places with the concentration found in each cuvet.
Collecting Data: Measuring how Absorbance Changes with Concentration
Start a new file in the Logger software.
Take an absorbance spectrum of your chosen color using the procedure from Part I of this lab. Use the 100% solution. Once finished, click the “Store” button to save the data. Save your new Logger file, too.
Click the “Wave” button at the top of your screen. Select Absorbance vs. Concentration. Change “Column Name” to Percent and adjust “Short Name” and “Units” as well.
To the right will be a display of the absorbance spectrum of the your chosen color. The software will automatically select the wavelength of maximum absorbance. Check that it is the wavelength at which your food coloring is most strongly absorbing. If it is not then change which check-box is selected. This is important because if you select a wavelength at which the solution absorbs no light then it will be impossible to see changes in absorbance as a result of changes in concentration. Consult with your instructor if you have questions.
Click OK. Click the “Collect” button at the top of the screen. Make sure that the standard solution with the highest concentration is in the device. In the lower-left-hand corner a display shows the absorbance of the sample in the spectrophotometer. Wait until the value is steady and unchanging and then click “Keep”. Enter the concentration of the sample when prompted, then click OK.
Remove the cuvet and replace it with the one with the next smaller concentration. Repeat the data collection procedure for each of the other samples: wait, click “Keep”, and enter the concentration. As you generate data the software will automatically create a graph. If all is well all of the points will fall along a straight line.
Once you have finished collecting data click “Stop”. Then click “Store”. Save your Logger file.
Copy the newly generated data and paste it into Excel. Label the columns ‘Concentration’ and ‘Absorbance’. Concentration should be to the left of Absorbance so that it will be on the x-axis.
Highlight the data and create a scatter-plot with no lines connecting the data points. Add all appropriate titles and adust the axes as necessary to make a well-formatted graph.
Use the Excel software to generate a linear trendline. Display the equation and the R2 value on the graph. Move the equation to the upper-right-hand corner.
page break
Collecting Data: Measuring Concentration using Light
Mix 50 mL of your 100% solution with 50 mL of a 100%-solution from another group who chose the other color. Both groups can use this mixture. Fill a cuvet and find the absorbance at the same wavelength you used to generate data with the standard solutions. Remember to wait a moment to let the value settle down. Record the single absorbance number in your lab notebook. You will not be graphing this information: instead, you will use it to find the concentration of your chosen color in the mixture.
Mix 50 mL of your 25% solution with 50 mL of a 25%-solution from another group who chose the other color. Both groups can use this mixture. Fill a cuvet and find the absorbance at the wavelength you used to generate data with the standard solutions. Remember to wait a moment to let the value settle down. Record the single absorbance value in your lab notebook.
Post-lab Questions
Answer the following questions in a typed document on a separate paper. As part of your report you must include the answers to the Pre-lab questions, your formatted and labeled graphs, and the answers to the questions below. This lab does not require a formal lab report.
To describe an absorption spectrum you must give numerical values of the wavelengths for the major peaks. Relate these wavelengths to the colors of the spectrum and explain how it is that the missing light explains the color you perceive when you look at the food coloring in the water.
Describe and interpret the graph of the absorbance of light by the blue food coloring.
Describe and interpret the graph of the absorbance of light by the green food coloring.
Describe and interpret the graph of the absorbance of light by the yellow food coloring.
In the pre-lab you were asked to predict the absorption spectrum of the blue food coloring. Do the data match your prediction? If not try to figure out where you went wrong and why. Write a sentence or two explaining why the data are different from your prediction. If your data do match your prediction, then explain how you were able to get it right.
What similarities exist between human perception of color and the spectrophotometer? What differences are there?
Take a close look at the absorbance spectrum for the green food coloring and compare it to the blue and yellow spectra. Is it possible that the green food coloring is a mixture of other dyes? Justify your answer using your lab data.
If you mixed the yellow and blue food coloring and then made an absorbance spectrum what do you think it would look like? Why?
What is the slope of the trend line on the graph you created in Excel of concentration (percent) vs. absorbance? This slope is called the absorptivity constant and it relates concentration to absorbance.
The final steps in part two asked you to measure the absorbance for blue or yellow in a mixture of the two. You should have written down two numbers, one for each mixture. These numbers are the absorbance. Using these absorbance values, calculate the percentage of blue or yellow in the mixture. Here’s how you do it: The absorbance values you measured are y in the equation in Excel. Solve the equation in Excel for x (by hand) and plug in your y-value to find the concentration. Show your work for the calculation to find the percentage.
If you mixed the solutions as described in the procedure then the first mixture should be 50% and the second should be 12.5%. In the previous question you used an absorbance value to calculate the percentage. Does this calculation match the expected percentage? Why or why not?
A colored solution has several kinds of food coloring in it. If you want to test the solution for the presence of the red food coloring then what one wavelength would be best for detecting it? Why?